%matplotlib inline
from IPython.display import HTML
import matplotlib.pyplot as plt
import requests
import pandas as pd
import numpy as np
import seaborn as sns
sns.set_style('white')
sns.set_context('talk', font_scale=1.2)
The Very Hungry Caterpillar example
HTML('<blockquote class="twitter-tweet" lang="he"><p lang="en" dir="ltr">Hmm, I don't know about this caterpillar rearing manual. I thought P.rapae had an obligate association w/ Brassica. <a href="http://t.co/M10dqbOYlN">pic.twitter.com/M10dqbOYlN</a></p>— Christie Bahlai (@cbahlai) <a href="https://twitter.com/cbahlai/status/597462491166150656">מאי 10, 2015</a></blockquote><script async src="//platform.twitter.com/widgets.js" charset="utf-8"></script>')
Hmm, I don't know about this caterpillar rearing manual. I thought P.rapae had an obligate association w/ Brassica. pic.twitter.com/M10dqbOYlN
— Christie Bahlai (@cbahlai) מאי 10, 2015HTML('<blockquote class="twitter-tweet" lang="he"><p lang="en" dir="ltr">This is a terrible dataset about caterpillar diet. How did it got published? <a href="http://t.co/XkAq51HxEP">pic.twitter.com/XkAq51HxEP</a></p>— Timothée Poisot (@tpoi) <a href="https://twitter.com/tpoi/status/591041490618552320">אפריל 23, 2015</a></blockquote><script async src="//platform.twitter.com/widgets.js" charset="utf-8"></script>')
This is a terrible dataset about caterpillar diet. How did it got published? pic.twitter.com/XkAq51HxEP
— Timothée Poisot (@tpoi) אפריל 23, 2015HTML('<blockquote class="twitter-tweet" data-partner="tweetdeck"><p lang="und" dir="ltr"><a href="https://twitter.com/tpoi">@tpoi</a> <a href="https://twitter.com/kara_woo">@kara_woo</a> <a href="https://twitter.com/cbahlai">@cbahlai</a> <a href="http://t.co/5lj9EzuKjW">pic.twitter.com/5lj9EzuKjW</a></p>— Yoav Ram (@yoavram) <a href="https://twitter.com/yoavram/status/597518650082365440">May 10, 2015</a></blockquote><script async src="//platform.twitter.com/widgets.js" charset="utf-8"></script>')
@tpoi @kara_woo @cbahlai pic.twitter.com/5lj9EzuKjW
— Yoav Ram (@yoavram) May 10, 2015
HTML('<blockquote class="twitter-tweet" data-partner="tweetdeck"><p lang="en" dir="ltr">[blog] How hungry are caterpillars anyway? <a href="http://t.co/SvImkHYHhR">http://t.co/SvImkHYHhR</a> <a href="https://twitter.com/hashtag/opendata?src=hash">#opendata</a></p>— Timothée Poisot (@tpoi) <a href="https://twitter.com/tpoi/status/597518409203589122">May 10, 2015</a></blockquote><script async src="//platform.twitter.com/widgets.js" charset="utf-8"></script>')
[blog] How hungry are caterpillars anyway? http://t.co/SvImkHYHhR #opendata
— Timothée Poisot (@tpoi) May 10, 2015
We will learn how to use the Global Biotic Interactions (globi) web API with Python to check How hungry are caterpillars anyway? (sort of).
Web API
First, what is a web API?
Modern web APIs use are RESTful Application Programming Interface that return responses in JSON format (or sometimes XML) over HTTP (or securely over HTTPS - guess what the S stands for).
- HTTP: a protocol for transfering text files on the internet
- JSON: a file format, very similar to Python's
dict. - REST: a common convention for designing web applications that allow querying and retrieving (and sometimes creating, changing and deleting) data.
A web API is a language that allows computers to talk to computers (so my computer, running Python, to talk to a computer abroad used as the server for globi).
The nouns of the languages are URLs. These are Universal Resource Locations (also sometimes URI, with Identifier) and are used to identify resources on the World Wide Web. For example, our course website URL is at http://py4life.github.io/TAU2015. This URL has structure (protocol - HTTP; domain - github.io, used by github to host user websites; subdomain - py4life, used to denote the github user Py4Life; and TAU2015 - the resource requested.
The verbs of this language are GET, POST, PATCH and DELETE (there are a bunch of others but these are the major ones) that allow us to retrieve a resource and change it (add a new resource with POST, modify and existing one with PATCH, and delete it with DELETE). These are the basic things we can do on the web to things that are represented by URLs.
So I can read lecture 1 by doing a GET on http://nbviewer.ipython.org/github/Py4Life/TAU2015/blob/master/lecture1.ipynb. I can create send form on the web by doing a POST. But machines like to talk to one another using all the verbs, asking each other for resources, adding new resources, changing and deleting existing ones.
See this nice post by Ryan Tomayko on explaining REST.
Using the API
Let's try it, following Poisot's lead on The Very Hungry Caterpillar.
We will use requests - a Python HTTP library for humans - to connect to the globi API. requests is much better and nicer than urllib is, and it should be installed, but if not just use conda install requests or pip install requests.
For our purpose we only need to GET information from the API, and we want to get infromation regarding interactions, so the base URL is http://api.globalbioticinteractions.org/interaction - the protocol is HTTP (this is the language we use), the globalbioticinteractions.org is the organization we are talking with, through their api subdomain, and we are interested in interaction resources.
Which interactions? This is specified using parameters - you put a ? before the parameters, separate them with &, and spcify them by key=value. This is similar to how we call a function in Python using (...), ,, and = for the same purposes.
We want interactions where the source taxon is Pireis and the type of interaction is eats - what does Pieris eats!
The URL is: http://api.globalbioticinteractions.org/interaction?sourceTaxon=Pieris&interactionType=eats.
How do I know the name of the domain, the interaction endpoint and the parameter names? From the API docs.
response = requests.get("http://api.globalbioticinteractions.org/interaction?sourceTaxon=Pieris&interactionType=eats")
print("OK:", response.ok)
OK: True
The respose payload is in JSON format. JSON is very similar to dict:
print(response.text[:500])
{
  "columns" : [ "source_taxon_external_id", "source_taxon_name", "source_taxon_path", "source_specimen_life_stage", "source_specimen_basis_of_record", "interaction_type", "target_taxon_external_id", "target_taxon_name", "target_taxon_path", "target_specimen_life_stage", "target_specimen_basis_of_record", "latitude", "longitude", "study_title" ],
  "data" : [ [ "EOL:174006", "Pieris marginalis", "Animalia | Bilateria | Protostomia | Ecdysozoa | Arthropoda | Hexapoda | Insecta | Pterygota | Neop
Calling the json method will return the payload as a dict:
payload = response.json()
print(type(payload))
<class 'dict'>
Now we need to work out the details of how the data is kept inside this dict. We can look it up in the API, but we might be able to do it on our own by just looking at the keys and values. This is why json is a nice format - it is just as easily read by humans as it is rad by machines, becoming the developer's work easier.
print(len(payload))
print(payload.keys())
print(payload['data'][:3])
2
dict_keys(['data', 'columns'])
[['EOL:174006', 'Pieris marginalis', 'Animalia | Bilateria | Protostomia | Ecdysozoa | Arthropoda | Hexapoda | Insecta | Pterygota | Neoptera | Holometabola | Lepidoptera | Papilionoidea | Pieridae | Pierinae | Pierini | Pierina | Pieris | Pieris marginalis', None, None, 'eats', 'EOL:29914', 'Rubus', 'Plantae | Tracheophyta | Magnoliopsida | Rosales | Rosaceae | Rubus | Rubus status', None, None, None, None, None], ['EOL:174006', 'Pieris marginalis', 'Animalia | Bilateria | Protostomia | Ecdysozoa | Arthropoda | Hexapoda | Insecta | Pterygota | Neoptera | Holometabola | Lepidoptera | Papilionoidea | Pieridae | Pierinae | Pierini | Pierina | Pieris | Pieris marginalis', None, None, 'eats', 'EOL:37457', 'Arabis', 'Plantae | Tracheophyta | Magnoliopsida | Brassicales | Brassicaceae | Arabis', None, None, None, None, None], ['EOL:174006', 'Pieris marginalis', 'Animalia | Bilateria | Protostomia | Ecdysozoa | Arthropoda | Hexapoda | Insecta | Pterygota | Neoptera | Holometabola | Lepidoptera | Papilionoidea | Pieridae | Pierinae | Pierini | Pierina | Pieris | Pieris marginalis', None, None, 'eats', 'EOL:37718', 'Rorippa', 'Plantae | Tracheophyta | Magnoliopsida | Brassicales | Brassicaceae | Rorippa', None, None, None, None, None]]
The response has two fields, columns and data, corresponding to the data frame's column names and rows. That's great because we can push it right into a pandas.DataFrame:
print(payload['columns'])
['source_taxon_external_id', 'source_taxon_name', 'source_taxon_path', 'source_specimen_life_stage', 'source_specimen_basis_of_record', 'interaction_type', 'target_taxon_external_id', 'target_taxon_name', 'target_taxon_path', 'target_specimen_life_stage', 'target_specimen_basis_of_record', 'latitude', 'longitude', 'study_title']
print(payload['data'][0])
['EOL:174006', 'Pieris marginalis', 'Animalia | Bilateria | Protostomia | Ecdysozoa | Arthropoda | Hexapoda | Insecta | Pterygota | Neoptera | Holometabola | Lepidoptera | Papilionoidea | Pieridae | Pierinae | Pierini | Pierina | Pieris | Pieris marginalis', None, None, 'eats', 'EOL:29914', 'Rubus', 'Plantae | Tracheophyta | Magnoliopsida | Rosales | Rosaceae | Rubus | Rubus status', None, None, None, None, None]
We are lucky, sometimes it takes much more work to process the response into the data frame we like so much.
df = pd.DataFrame(payload['data'], columns=payload['columns'])
print(df.shape)
df.head()
(232, 14)
| source_taxon_external_id | source_taxon_name | source_taxon_path | source_specimen_life_stage | source_specimen_basis_of_record | interaction_type | target_taxon_external_id | target_taxon_name | target_taxon_path | target_specimen_life_stage | target_specimen_basis_of_record | latitude | longitude | study_title | |
|---|---|---|---|---|---|---|---|---|---|---|---|---|---|---|
| 0 | EOL:174006 | Pieris marginalis | Animalia | Bilateria | Protostomia | Ecdysozoa... | None | None | eats | EOL:29914 | Rubus | Plantae | Tracheophyta | Magnoliopsida | Rosal... | None | None | None | None | None |
| 1 | EOL:174006 | Pieris marginalis | Animalia | Bilateria | Protostomia | Ecdysozoa... | None | None | eats | EOL:37457 | Arabis | Plantae | Tracheophyta | Magnoliopsida | Brass... | None | None | None | None | None |
| 2 | EOL:174006 | Pieris marginalis | Animalia | Bilateria | Protostomia | Ecdysozoa... | None | None | eats | EOL:37718 | Rorippa | Plantae | Tracheophyta | Magnoliopsida | Brass... | None | None | None | None | None |
| 3 | EOL:174006 | Pieris marginalis | Animalia | Bilateria | Protostomia | Ecdysozoa... | None | None | eats | EOL:37667 | Cardamine | Plantae | Tracheophyta | Magnoliopsida | Brass... | None | None | None | None | None |
| 4 | EOL:176683 | Pieris rapae | Animalia | Arthropoda | Insecta | Lepidoptera ... | None | None | eats | EOL:467679 | Centaurea melitensis | Plantae | Tracheophyta | Magnoliopsida | Aster... | None | None | None | None | None |
Using the data
Let's see what each caterpillar eats. We got the eats interactions, so let's just leave the source and target taxons:
cols = df.columns.tolist()
cols.remove('source_taxon_name')
cols.remove('target_taxon_name')
print(cols)
['source_taxon_external_id', 'source_taxon_path', 'source_specimen_life_stage', 'source_specimen_basis_of_record', 'interaction_type', 'target_taxon_external_id', 'target_taxon_path', 'target_specimen_life_stage', 'target_specimen_basis_of_record', 'latitude', 'longitude', 'study_title']
df.drop(labels=cols, axis=1, inplace=True)
df.head()
| source_taxon_name | target_taxon_name | |
|---|---|---|
| 0 | Pieris marginalis | Rubus |
| 1 | Pieris marginalis | Arabis |
| 2 | Pieris marginalis | Rorippa |
| 3 | Pieris marginalis | Cardamine |
| 4 | Pieris rapae | Centaurea melitensis |
Next, we count how many target taxons occur for each source taxon. For that, we group by source and aggregate by length (I made sure before that each source-target pair appears only once. How??).
The groupby made source_taxon_name become an index rather than a column and that's why we call reset_index.
table = df.groupby(by='source_taxon_name').aggregate(len).reset_index()
table.head()
| source_taxon_name | target_taxon_name | |
|---|---|---|
| 0 | Pieris brassicae | 55 |
| 1 | Pieris brassicoides | 3 |
| 2 | Pieris canidia | 10 |
| 3 | Pieris cheiranthi | 1 |
| 4 | Pieris deota | 1 |
Finally we rename the columns to make them more meaningful and we sort the table by the number of target taxons. Then we print and plot:
table = table.rename(columns={'source_taxon_name':'Pieris species', 'target_taxon_name': 'Number of known items in diet'})
table = table.sort('Number of known items in diet', ascending=False)
table
| Pieris species | Number of known items in diet | |
|---|---|---|
| 12 | Pieris rapae | 91 |
| 0 | Pieris brassicae | 55 |
| 11 | Pieris napi | 51 |
| 2 | Pieris canidia | 10 |
| 13 | Pieris virginiensis | 6 |
| 8 | Pieris marginalis | 4 |
| 1 | Pieris brassicoides | 3 |
| 6 | Pieris krueperi | 3 |
| 5 | Pieris ergane | 2 |
| 7 | Pieris mannii | 2 |
| 10 | Pieris naganum | 2 |
| 3 | Pieris cheiranthi | 1 |
| 4 | Pieris deota | 1 |
| 9 | Pieris melete | 1 |
table.plot(x="Pieris species", y="Number of known items in diet", kind="barh", legend=False)
plt.ylabel('Number of known items in diet')
plt.grid(False)
sns.despine()

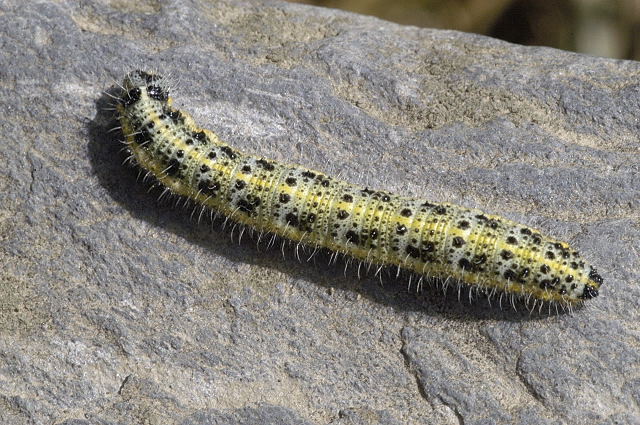
A very hungry caterpillar
Pieris rapae

Pieris brassicae
Fin
This notebook is part of the Python Programming for Life Sciences Graduate Students course given in Tel-Aviv University, Spring 2015.
The notebook was written using Python 3.4.1 and IPython 3.1.0 (download from PyZo).
The code is available at https://github.com/Py4Life/TAU2015/blob/master/globi_caterpillars.ipynb.
The notebook can be viewed online at http://nbviewer.ipython.org/github/Py4Life/TAU2015/blob/master/globi_caterpillars.ipynb.
This work is licensed under a Creative Commons Attribution-ShareAlike 3.0 Unported License.
![]()