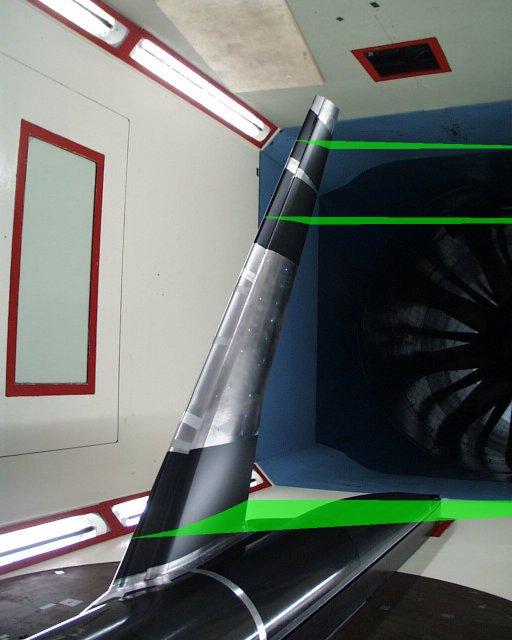
# 2nd High Lift Prediction Workshop #### Alpha = 7deg , Re = 15E+06 , DLR - F11 configuration
 #### References http://hiliftpw.larc.nasa.gov/
Define case name
This is the solver case to be analysed
In [1]:
case_name = 'v2'
Define Data Location
For remote data the interaction will use ssh to securely interact with the data
This uses the reverse connection capability in paraview so that the paraview server can be submitted to a job scheduler
Note: The default paraview server connection will use port 11111
In [2]:
remote_data = True

data_dir='/gpfs/cfms/workarea/projects/hyper_flux/high_lift/7deg_v3'

data_host='acimpoeru@vis03'

remote_server_auto = True

paraview_cmd='mpiexec /gpfs/cfms/apps/bin/pvserver'
if not remote_server_auto:
    paraview_cmd=None

if not remote_data:
    data_host='localhost'
    paraview_cmd=None
Initialise Environment
In [3]:
%pylab inline
from paraview.simple import *
paraview.simple._DisableFirstRenderCameraReset()
import pylab as pl
import math
import numpy as np
Populating the interactive namespace from numpy and matplotlib
paraview version 4.2.0-69-g6666fe8
Data Connection
This starts paraview server on remote host and connects
In [4]:
from zutil.post import pvserver_connect
if remote_data:
    pvserver_connect(data_host=data_host,data_dir=data_dir,paraview_cmd=paraview_cmd)
[acimpoeru@vis03] Executing task 'port_test'
Selected Port: 12000
[acimpoeru@vis03] Executing task 'pvserver'
[acimpoeru@vis03] run: /bin/bash -l -c "cd /gpfs/cfms/workarea/projects/hyper_flux/high_lift/7deg_v3 && sleep 2;mpiexec /gpfs/cfms/apps/bin/pvserver -rc --client-host=localhost -sp=12000"
[acimpoeru@vis03] out:
[acimpoeru@vis03] out: 		   _____ ______ __  __  _____
[acimpoeru@vis03] out: 		  / ____|  ____|  \/  |/ ____|
[acimpoeru@vis03] out: 		 | |    | |__  | \  / | (___
[acimpoeru@vis03] out: 		 | |    |  __| | |\/| |\___ \
[acimpoeru@vis03] out: 		 | |____| |    | |  | |____) |
[acimpoeru@vis03] out: 		  \_____|_|    |_|  |_|_____/
[acimpoeru@vis03] out:
[acimpoeru@vis03] out:
[acimpoeru@vis03] out:
[acimpoeru@vis03] out: ++++++++++++++++++++++++++++: System Data :++++++++++++++++++++++++++++
[acimpoeru@vis03] out: + Hostname = vis03
[acimpoeru@vis03] out: + Kernel = 2.6.32-358.el6.x86_64
[acimpoeru@vis03] out: + RHEL Release = Red Hat Enterprise Linux Server release 6.4 (Santiago)
[acimpoeru@vis03] out: + Uptime = 14:30:00 up 3 days, 4:14, 10 users,
[acimpoeru@vis03] out: + CPU = 2x Intel Xeon X5570 @ 2.93GHz
[acimpoeru@vis03] out: + Memory = 132148768 kB
[acimpoeru@vis03] out: ++++++++++++++++++++++++++++: User Data :++++++++++++++++++++++++++++++
[acimpoeru@vis03] out: + Username = acimpoeru
[acimpoeru@vis03] out: +++++++++++++++++++++++: Contact Information :+++++++++++++++++++++++++
[acimpoeru@vis03] out: + in case of any problems, contact: support@cfms.org.uk
[acimpoeru@vis03] out: + for feedback, contact: feedback@cfms.org.uk
[acimpoeru@vis03] out: +++++++++++++++++++++: Maintenance Information :+++++++++++++++++++++++
[acimpoeru@vis03] out: + There is no planned maintenance taking place this week
[acimpoeru@vis03] out: +++++++++++++++++++++++++++++++++++++++++++++++++++++++++++++++++++++++
[acimpoeru@vis03] out:
[acimpoeru@vis03] out: [acimpoeru@vis03] rtunnel: opened reverse tunnel: (u'127.0.0.1', 55735) -> ('172.20.1.25', 22) -> ('localhost', 11111)
Connecting to client (reverse connection requested)...
[acimpoeru@vis03] out: Connection URL: csrc://localhost:12000
[acimpoeru@vis03] out: Client connected.
[acimpoeru@vis03] out:
Get control dictionary
In [5]:
from zutil.post import get_case_parameters,print_html_parameters
parameters=get_case_parameters(case_name,data_host=data_host,data_dir=data_dir)
Get status file
In [6]:
from zutil.post import get_status_dict
status=get_status_dict(case_name,data_host=data_host,data_dir=data_dir)
num_procs = str(status['num processor'])
Define test conditions - ETW experiment
In [7]:
alpha = 7.0 # degrees

Re = 15.0e06 # Reynolds number

reference_area = 419130.0 # frontal areas in mm^2

reference_length = 347.09 # mm^2

reference_span = 1400.0 #mm

pressure = 295000.0 # Pa

temperature = 114.0 # i.e.

gamma = 1.4

from IPython.display import HTML
HTML(print_html_parameters(parameters))
Out[7]:
| pressure | 295000.0 |
| temperature | 114.0 |
| Reynolds No | 15100000.0 |
| Ref length | 347.09 |
| Speed | 0.0 |
| Mach No | 0.175 |
### Read experimental data from prediction workshop
In [8]:
import zutil
import zutil.post as post
reload(zutil)
reload(post)
from zutil.post import get_csv_data
import os
import glob
#import pandas as pd
#import hashlib

#position 1
cp_ps01 = zutil.post.get_csv_data("/gpfs/cfms/workarea/projects/hyper_flux/high_lift/results/results_csv_format/cp_ps01.csv",header=True,remote=True,delim=',')
cp_ps01_flap = zutil.post.get_csv_data("/gpfs/cfms/workarea/projects/hyper_flux/high_lift/results/results_csv_format/cp_ps01_flap.csv",header=True,remote=True,delim=',')
cp_ps01_slat = zutil.post.get_csv_data("/gpfs/cfms/workarea/projects/hyper_flux/high_lift/results/results_csv_format/cp_ps01_slat.csv",header=True,remote=True,delim=',')

#position 2
cp_ps02 = zutil.post.get_csv_data("/gpfs/cfms/workarea/projects/hyper_flux/high_lift/results/results_csv_format/cp_ps02.csv",header=True,remote=True,delim=',')
cp_ps02_flap = zutil.post.get_csv_data("/gpfs/cfms/workarea/projects/hyper_flux/high_lift/results/results_csv_format/cp_ps02_flap.csv",header=True,remote=True,delim=',')
cp_ps02_slat = zutil.post.get_csv_data("/gpfs/cfms/workarea/projects/hyper_flux/high_lift/results/results_csv_format/cp_ps02_slat.csv",header=True,remote=True,delim=',')

#position 4
cp_ps04 = zutil.post.get_csv_data("/gpfs/cfms/workarea/projects/hyper_flux/high_lift/results/results_csv_format/cp_ps04.csv",header=True,remote=True,delim=',')
cp_ps04_flap = zutil.post.get_csv_data("/gpfs/cfms/workarea/projects/hyper_flux/high_lift/results/results_csv_format/cp_ps04_flap.csv",header=True,remote=True,delim=',')
cp_ps04_slat = zutil.post.get_csv_data("/gpfs/cfms/workarea/projects/hyper_flux/high_lift/results/results_csv_format/cp_ps04_slat.csv",header=True,remote=True,delim=',')


#position 5

cp_ps05 = zutil.post.get_csv_data("/gpfs/cfms/workarea/projects/hyper_flux/high_lift/results/results_csv_format/cp_ps05.csv",header=True,remote=True,delim=',')
cp_ps05_flap = zutil.post.get_csv_data("/gpfs/cfms/workarea/projects/hyper_flux/high_lift/results/results_csv_format/cp_ps05_flap.csv",header=True,remote=True,delim=',')
cp_ps05_slat = zutil.post.get_csv_data("/gpfs/cfms/workarea/projects/hyper_flux/high_lift/results/results_csv_format/cp_ps05_slat.csv",header=True,remote=True,delim=',')

#position 6
cp_ps06 = zutil.post.get_csv_data("/gpfs/cfms/workarea/projects/hyper_flux/high_lift/results/results_csv_format/cp_ps06.csv",header=True,remote=True,delim=',')
cp_ps06_flap = zutil.post.get_csv_data("/gpfs/cfms/workarea/projects/hyper_flux/high_lift/results/results_csv_format/cp_ps06_flap.csv",header=True,remote=True,delim=',')
cp_ps06_slat = zutil.post.get_csv_data("/gpfs/cfms/workarea/projects/hyper_flux/high_lift/results/results_csv_format/cp_ps06_slat.csv",header=True,remote=True,delim=',')

#position 7

cp_ps07 = zutil.post.get_csv_data("/gpfs/cfms/workarea/projects/hyper_flux/high_lift/results/results_csv_format/cp_ps07.csv",header=True,remote=True,delim=',')
cp_ps07_flap = zutil.post.get_csv_data("/gpfs/cfms/workarea/projects/hyper_flux/high_lift/results/results_csv_format/cp_ps07_flap.csv",header=True,remote=True,delim=',')
cp_ps07_slat = zutil.post.get_csv_data("/gpfs/cfms/workarea/projects/hyper_flux/high_lift/results/results_csv_format/cp_ps07_slat.csv",header=True,remote=True,delim=',')

#position 8
cp_ps08 = zutil.post.get_csv_data("/gpfs/cfms/workarea/projects/hyper_flux/high_lift/results/results_csv_format/cp_ps08.csv",header=True,remote=True,delim=',')
cp_ps08_flap = zutil.post.get_csv_data("/gpfs/cfms/workarea/projects/hyper_flux/high_lift/results/results_csv_format/cp_ps08_flap.csv",header=True,remote=True,delim=',')
cp_ps08_slat = zutil.post.get_csv_data("/gpfs/cfms/workarea/projects/hyper_flux/high_lift/results/results_csv_format/cp_ps08_slat.csv",header=True,remote=True,delim=',')


#position 9
cp_ps09 = zutil.post.get_csv_data("/gpfs/cfms/workarea/projects/hyper_flux/high_lift/results/results_csv_format/cp_ps09.csv",header=True,remote=True,delim=',')
cp_ps09_flap = zutil.post.get_csv_data("/gpfs/cfms/workarea/projects/hyper_flux/high_lift/results/results_csv_format/cp_ps09_flap.csv",header=True,remote=True,delim=',')
cp_ps09_slat = zutil.post.get_csv_data("/gpfs/cfms/workarea/projects/hyper_flux/high_lift/results/results_csv_format/cp_ps09_slat.csv",header=True,remote=True,delim=',')

#position 10
cp_ps10 = zutil.post.get_csv_data("/gpfs/cfms/workarea/projects/hyper_flux/high_lift/results/results_csv_format/cp_ps10.csv",header=True,remote=True,delim=',')
cp_ps10_flap = zutil.post.get_csv_data("/gpfs/cfms/workarea/projects/hyper_flux/high_lift/results/results_csv_format/cp_ps10_flap.csv",header=True,remote=True,delim=',')
cp_ps10_slat = zutil.post.get_csv_data("/gpfs/cfms/workarea/projects/hyper_flux/high_lift/results/results_csv_format/cp_ps10_slat.csv",header=True,remote=True,delim=',')

#position 11

cp_ps11 = zutil.post.get_csv_data("/gpfs/cfms/workarea/projects/hyper_flux/high_lift/results/results_csv_format/cp_ps11.csv",header=True,remote=True,delim=',')
cp_ps11_flap = zutil.post.get_csv_data("/gpfs/cfms/workarea/projects/hyper_flux/high_lift/results/results_csv_format/cp_ps11_flap.csv",header=True,remote=True,delim=',')
cp_ps11_slat = zutil.post.get_csv_data("/gpfs/cfms/workarea/projects/hyper_flux/high_lift/results/results_csv_format/cp_ps11_slat.csv",header=True,remote=True,delim=',')


##### Try to use a loop over those files


#path = '/Users/andrei/Documents/zPost/ipynb/Hyper_Flux/2nd_High_Lift_Prediction_Workshop/results_v2/results_csv_format/*.csv'
#myfiles  = np.zeros(10)
#files=glob.glob(path)

#for i in range(0,len(files)):
    #print files
    #data[i] = zutil.post.get_csv_data(files[i],header=True,remote=False,delim=',')
#a=files[0]

#exp = zutil.post.get_csv_data(a,header=True,remote=False,delim=',')


#print files[0]
#print exp
print cp_ps11_slat.keys()
['x/c_local', 'eta', 'z/c_local', 'X', 'Y', 'Z', 'cp_ETW_RUN238']
## Cp profiles at different positions
In [9]:
import zutil
import zutil.post as post
reload(zutil)
reload(post)
from zutil.post import cp_profile_wall_from_file
# ----------------------------WING --------------------------------
#-----1
def wing_plot_cp_profile_1(w_ax,file_root,w_span_loc_1):
force_data = cp_profile_wall_from_file(file_root,
[0.0,1.0,0.0],
[0.0, w_span_loc_1,0.0],
func=wing_plot_array_1,
axis=w_ax,
w_span_loc_1=w_span_loc_1,
alpha=alpha)
w_loop_counter_1 = 0
w_loop_data_1 = {}
def wing_plot_array_1(data_array,pts_array,**kwargs):
global w_loop_counter_1,w_loop_data_1
w_ax = kwargs['axis']
w_span_loc_1 = kwargs['w_span_loc_1']
cp_array = data_array.GetPointData()['cp']
chord_array = data_array.GetPointData()['chord']
w_ax.plot(chord_array, cp_array , 'b.',color='b',label='zCFD SST')
w_loop_data_1[w_loop_counter_1] = (chord_array,cp_array)
w_loop_counter_1 += 1
#-----------2
def wing_plot_cp_profile_2(w_ax,file_root,w_span_loc_2):
force_data = cp_profile_wall_from_file(file_root,
[0.0,1.0,0.0],
[0.0, w_span_loc_2,0.0],
func=wing_plot_array_2,
axis=w_ax,
w_span_loc_2=w_span_loc_2,
alpha=alpha)
w_loop_counter_2 = 0
w_loop_data_2 = {}
def wing_plot_array_2(data_array,pts_array,**kwargs):
global w_loop_counter_2,w_loop_data_2
w_ax = kwargs['axis']
w_span_loc_2 = kwargs['w_span_loc_2']
cp_array = data_array.GetPointData()['cp']
chord_array = data_array.GetPointData()['chord']
w_ax.plot(chord_array, cp_array , 'b.',color='b',label='zCFD SST')
w_loop_data_2[w_loop_counter_2] = (chord_array,cp_array)
w_loop_counter_2 += 1
#---------------4
def wing_plot_cp_profile_4(w_ax,file_root,w_span_loc_4):
force_data = cp_profile_wall_from_file(file_root,
[0.0,1.0,0.0],
[0.0, w_span_loc_4,0.0],
func=wing_plot_array_4,
axis=w_ax,
w_span_loc_4=w_span_loc_4,
alpha=alpha)
w_loop_counter_4 = 0
w_loop_data_4 = {}
def wing_plot_array_4(data_array,pts_array,**kwargs):
global w_loop_counter_4,w_loop_data_4
w_ax = kwargs['axis']
w_span_loc_4 = kwargs['w_span_loc_4']
cp_array = data_array.GetPointData()['cp']
chord_array = data_array.GetPointData()['chord']
w_ax.plot(chord_array, cp_array , 'b.',color='b',label='zCFD SST')
w_loop_data_4[w_loop_counter_4] = (chord_array,cp_array)
w_loop_counter_4 += 1
#--------------5
def wing_plot_cp_profile_5(w_ax,file_root,w_span_loc_5):
force_data = cp_profile_wall_from_file(file_root,
[0.0,1.0,0.0],
[0.0, w_span_loc_5,0.0],
func=wing_plot_array_5,
axis=w_ax,
w_span_loc_5=w_span_loc_5,
alpha=alpha)
w_loop_counter_5 = 0
w_loop_data_5 = {}
def wing_plot_array_5(data_array,pts_array,**kwargs):
global w_loop_counter_5,w_loop_data_5
w_ax = kwargs['axis']
w_span_loc_5 = kwargs['w_span_loc_5']
cp_array = data_array.GetPointData()['cp']
chord_array = data_array.GetPointData()['chord']
w_ax.plot(chord_array, cp_array , 'b.',color='b',label='zCFD SST')
w_loop_data_5[w_loop_counter_5] = (chord_array,cp_array)
w_loop_counter_5 += 1
#------------6
def wing_plot_cp_profile_6(w_ax,file_root,w_span_loc_6):
force_data = cp_profile_wall_from_file(file_root,
[0.0,1.0,0.0],
[0.0, w_span_loc_6,0.0],
func=wing_plot_array_6,
axis=w_ax,
w_span_loc_6=w_span_loc_6,
alpha=alpha)
w_loop_counter_6 = 0
w_loop_data_6 = {}
def wing_plot_array_6(data_array,pts_array,**kwargs):
global w_loop_counter_6,w_loop_data_6
w_ax = kwargs['axis']
w_span_loc_6 = kwargs['w_span_loc_6']
cp_array = data_array.GetPointData()['cp']
chord_array = data_array.GetPointData()['chord']
w_ax.plot(chord_array, cp_array , 'b.',color='b',label='zCFD SST')
w_loop_data_6[w_loop_counter_6] = (chord_array,cp_array)
w_loop_counter_6 += 1
#------------7
def wing_plot_cp_profile_7(w_ax,file_root,w_span_loc_7):
force_data = cp_profile_wall_from_file(file_root,
[0.0,1.0,0.0],
[0.0, w_span_loc_7,0.0],
func=wing_plot_array_7,
axis=w_ax,
w_span_loc_7=w_span_loc_7,
alpha=alpha)
w_loop_counter_7 = 0
w_loop_data_7 = {}
def wing_plot_array_7(data_array,pts_array,**kwargs):
global w_loop_counter_7,w_loop_data_7
w_ax = kwargs['axis']
w_span_loc_7 = kwargs['w_span_loc_7']
cp_array = data_array.GetPointData()['cp']
chord_array = data_array.GetPointData()['chord']
w_ax.plot(chord_array, cp_array , 'b.',color='b',label='zCFD SST')
w_loop_data_7[w_loop_counter_7] = (chord_array,cp_array)
w_loop_counter_7 += 1
#------------8
def wing_plot_cp_profile_8(w_ax,file_root,w_span_loc_8):
force_data = cp_profile_wall_from_file(file_root,
[0.0,1.0,0.0],
[0.0, w_span_loc_8,0.0],
func=wing_plot_array_8,
axis=w_ax,
w_span_loc_8=w_span_loc_8,
alpha=alpha)
w_loop_counter_8 = 0
w_loop_data_8 = {}
def wing_plot_array_8(data_array,pts_array,**kwargs):
global w_loop_counter_8,w_loop_data_8
w_ax = kwargs['axis']
w_span_loc_8 = kwargs['w_span_loc_8']
cp_array = data_array.GetPointData()['cp']
chord_array = data_array.GetPointData()['chord']
w_ax.plot(chord_array, cp_array , 'b.',color='b',label='zCFD SST')
w_loop_data_8[w_loop_counter_8] = (chord_array,cp_array)
w_loop_counter_8 += 1
#------------9
def wing_plot_cp_profile_9(w_ax,file_root,w_span_loc_9):
force_data = cp_profile_wall_from_file(file_root,
[0.0,1.0,0.0],
[0.0, w_span_loc_9,0.0],
func=wing_plot_array_9,
axis=w_ax,
w_span_loc_9=w_span_loc_9,
alpha=alpha)
w_loop_counter_9 = 0
w_loop_data_9 = {}
def wing_plot_array_9(data_array,pts_array,**kwargs):
global w_loop_counter_9,w_loop_data_9
w_ax = kwargs['axis']
w_span_loc_9 = kwargs['w_span_loc_9']
cp_array = data_array.GetPointData()['cp']
chord_array = data_array.GetPointData()['chord']
w_ax.plot(chord_array, cp_array , 'b.',color='b',label='zCFD SST')
w_loop_data_9[w_loop_counter_9] = (chord_array,cp_array)
w_loop_counter_9 += 1
#------------10
def wing_plot_cp_profile_10(w_ax,file_root,w_span_loc_10):
force_data = cp_profile_wall_from_file(file_root,
[0.0,1.0,0.0],
[0.0, w_span_loc_10,0.0],
func=wing_plot_array_10,
axis=w_ax,
w_span_loc_10=w_span_loc_10,
alpha=alpha)
w_loop_counter_10 = 0
w_loop_data_10 = {}
def wing_plot_array_10(data_array,pts_array,**kwargs):
global w_loop_counter_10,w_loop_data_10
w_ax = kwargs['axis']
w_span_loc_10 = kwargs['w_span_loc_10']
cp_array = data_array.GetPointData()['cp']
chord_array = data_array.GetPointData()['chord']
w_ax.plot(chord_array, cp_array , 'b.',color='b',label='zCFD SST')
w_loop_data_10[w_loop_counter_10] = (chord_array,cp_array)
w_loop_counter_10 += 1
#------------11
def wing_plot_cp_profile_11(w_ax,file_root,w_span_loc_11):
force_data = cp_profile_wall_from_file(file_root,
[0.0,1.0,0.0],
[0.0, w_span_loc_11,0.0],
func=wing_plot_array_11,
axis=w_ax,
w_span_loc_11=w_span_loc_11,
alpha=alpha)
w_loop_counter_11 = 0
w_loop_data_11 = {}
def wing_plot_array_11(data_array,pts_array,**kwargs):
global w_loop_counter_11,w_loop_data_11
w_ax = kwargs['axis']
w_span_loc_11 = kwargs['w_span_loc_11']
cp_array = data_array.GetPointData()['cp']
chord_array = data_array.GetPointData()['chord']
w_ax.plot(chord_array, cp_array , 'b.',color='b',label='zCFD SST')
w_loop_data_11[w_loop_counter_11] = (chord_array,cp_array)
w_loop_counter_11 += 1
# ----------------------------SLAT-----------------------------------
# ------------1
def slat_plot_cp_profile_1(ax,file_root,s_x_loc_1,s_y_loc_1,s_z_loc_1):
force_data = cp_profile_wall_from_file(file_root,
[0.003861,0.999926,0.011494], # the normal of the plane ----constant for the slat
[s_x_loc_1,s_y_loc_1,s_z_loc_1], # definition of the points
func=slat_plot_array_1,
axis=ax,
s_x_loc_1=s_x_loc_1,
s_y_loc_1=s_y_loc_1,
s_z_loc_1=s_z_loc_1,
alpha=alpha)
s_loop_counter_1 = 0
s_loop_data_1 = {}
def slat_plot_array_1(data_array,pts_array,**kwargs):
global s_loop_counter_1,s_loop_data_1
ax = kwargs['axis']
#s_span_loc = kwargs['s_span_loc']
s_x_loc_1 = kwargs['s_x_loc_1']
s_y_loc_1 = kwargs['s_y_loc_1']
s_z_loc_1 = kwargs['s_z_loc_1']
cp_array = data_array.GetPointData()['cp']
chord_array = data_array.GetPointData()['chord']
ax.plot(chord_array, cp_array , 'b.',color='b',label='zCFD SST')
#s_loop_data[s_loop_counter] = (pts_array,cp_array)
s_loop_data_1[s_loop_counter_1] = (chord_array,cp_array)
s_loop_counter_1 += 1
#----------------2
def slat_plot_cp_profile_2(ax,file_root,s_x_loc_2,s_y_loc_2,s_z_loc_2):
force_data = cp_profile_wall_from_file(file_root,
[0.003861,0.999926,0.011494], # the normal of the plane ----constant for the slat
[s_x_loc_2,s_y_loc_2,s_z_loc_2], # definition of the points
func=slat_plot_array_2,
axis=ax,
s_x_loc_2=s_x_loc_2,
s_y_loc_2=s_y_loc_2,
s_z_loc_2=s_z_loc_2,
alpha=alpha)
s_loop_counter_2 = 0
s_loop_data_2 = {}
def slat_plot_array_2(data_array,pts_array,**kwargs):
global s_loop_counter_2,s_loop_data_2
ax = kwargs['axis']
#s_span_loc = kwargs['s_span_loc']
s_x_loc_2 = kwargs['s_x_loc_2']
s_y_loc_2 = kwargs['s_y_loc_2']
s_z_loc_2 = kwargs['s_z_loc_2']
cp_array = data_array.GetPointData()['cp']
chord_array = data_array.GetPointData()['chord']
ax.plot(chord_array, cp_array , 'b.',color='b',label='zCFD SST')
#s_loop_data[s_loop_counter] = (pts_array,cp_array)
s_loop_data_2[s_loop_counter_2] = (chord_array,cp_array)
s_loop_counter_2 += 1
#----------------4
def slat_plot_cp_profile_4(ax,file_root,s_x_loc_4,s_y_loc_4,s_z_loc_4):
force_data = cp_profile_wall_from_file(file_root,
[0.003861,0.999926,0.011494], # the normal of the plane ----constant for the slat
[s_x_loc_4,s_y_loc_4,s_z_loc_4], # definition of the points
func=slat_plot_array_4,
axis=ax,
s_x_loc_4=s_x_loc_4,
s_y_loc_4=s_y_loc_4,
s_z_loc_4=s_z_loc_4,
alpha=alpha)
s_loop_counter_4 = 0
s_loop_data_4 = {}
def slat_plot_array_4(data_array,pts_array,**kwargs):
global s_loop_counter_4,s_loop_data_4
ax = kwargs['axis']
#s_span_loc = kwargs['s_span_loc']
s_x_loc_4 = kwargs['s_x_loc_4']
s_y_loc_4 = kwargs['s_y_loc_4']
s_z_loc_4 = kwargs['s_z_loc_4']
cp_array = data_array.GetPointData()['cp']
chord_array = data_array.GetPointData()['chord']
ax.plot(chord_array, cp_array , 'b.',color='b',label='zCFD SST')
#s_loop_data[s_loop_counter] = (pts_array,cp_array)
s_loop_data_4[s_loop_counter_4] = (chord_array,cp_array)
s_loop_counter_4 += 1
#----------------5
def slat_plot_cp_profile_5(ax,file_root,s_x_loc_5,s_y_loc_5,s_z_loc_5):
force_data = cp_profile_wall_from_file(file_root,
[0.003861,0.999926,0.011494], # the normal of the plane ----constant for the slat
[s_x_loc_5,s_y_loc_5,s_z_loc_5], # definition of the points
func=slat_plot_array_5,
axis=ax,
s_x_loc_5=s_x_loc_5,
s_y_loc_5=s_y_loc_5,
s_z_loc_5=s_z_loc_5,
alpha=alpha)
s_loop_counter_5 = 0
s_loop_data_5 = {}
def slat_plot_array_5(data_array,pts_array,**kwargs):
global s_loop_counter_5,s_loop_data_5
ax = kwargs['axis']
#s_span_loc = kwargs['s_span_loc']
s_x_loc_5 = kwargs['s_x_loc_5']
s_y_loc_5 = kwargs['s_y_loc_5']
s_z_loc_5 = kwargs['s_z_loc_5']
cp_array = data_array.GetPointData()['cp']
chord_array = data_array.GetPointData()['chord']
ax.plot(chord_array, cp_array , 'b.',color='b',label='zCFD SST')
#s_loop_data[s_loop_counter] = (pts_array,cp_array)
s_loop_data_5[s_loop_counter_5] = (chord_array,cp_array)
s_loop_counter_5 += 1
#---------------6
def slat_plot_cp_profile_6(ax,file_root,s_x_loc_6,s_y_loc_6,s_z_loc_6):
force_data = cp_profile_wall_from_file(file_root,
[0.003861,0.999926,0.011494], # the normal of the plane ----constant for the slat
[s_x_loc_6,s_y_loc_6,s_z_loc_6], # definition of the points
func=slat_plot_array_6,
axis=ax,
s_x_loc_6=s_x_loc_6,
s_y_loc_6=s_y_loc_6,
s_z_loc_6=s_z_loc_6,
alpha=alpha)
s_loop_counter_6 = 0
s_loop_data_6 = {}
def slat_plot_array_6(data_array,pts_array,**kwargs):
global s_loop_counter_6,s_loop_data_6
ax = kwargs['axis']
#s_span_loc = kwargs['s_span_loc']
s_x_loc_6 = kwargs['s_x_loc_6']
s_y_loc_6 = kwargs['s_y_loc_6']
s_z_loc_6 = kwargs['s_z_loc_6']
cp_array = data_array.GetPointData()['cp']
chord_array = data_array.GetPointData()['chord']
ax.plot(chord_array, cp_array , 'b.',color='b',label='zCFD SST')
#s_loop_data[s_loop_counter] = (pts_array,cp_array)
s_loop_data_6[s_loop_counter_6] = (chord_array,cp_array)
s_loop_counter_6 += 1
#--------------7
def slat_plot_cp_profile_7(ax,file_root,s_x_loc_7,s_y_loc_7,s_z_loc_7):
force_data = cp_profile_wall_from_file(file_root,
[0.003861,0.999926,0.011494], # the normal of the plane ----constant for the slat
[s_x_loc_7,s_y_loc_7,s_z_loc_7], # definition of the points
func=slat_plot_array_7,
axis=ax,
s_x_loc_7=s_x_loc_7,
s_y_loc_7=s_y_loc_7,
s_z_loc_7=s_z_loc_7,
alpha=alpha)
s_loop_counter_7 = 0
s_loop_data_7 = {}
def slat_plot_array_7(data_array,pts_array,**kwargs):
global s_loop_counter_7,s_loop_data_7
ax = kwargs['axis']
#s_span_loc = kwargs['s_span_loc']
s_x_loc_7 = kwargs['s_x_loc_7']
s_y_loc_7 = kwargs['s_y_loc_7']
s_z_loc_7 = kwargs['s_z_loc_7']
cp_array = data_array.GetPointData()['cp']
chord_array = data_array.GetPointData()['chord']
ax.plot(chord_array, cp_array , 'b.',color='b',label='zCFD SST')
#s_loop_data[s_loop_counter] = (pts_array,cp_array)
s_loop_data_7[s_loop_counter_7] = (chord_array,cp_array)
s_loop_counter_7 += 1
#---------------8
def slat_plot_cp_profile_8(ax,file_root,s_x_loc_8,s_y_loc_8,s_z_loc_8):
force_data = cp_profile_wall_from_file(file_root,
[0.003861,0.999926,0.011494], # the normal of the plane ----constant for the slat
[s_x_loc_8,s_y_loc_8,s_z_loc_8], # definition of the points
func=slat_plot_array_8,
axis=ax,
s_x_loc_8=s_x_loc_8,
s_y_loc_8=s_y_loc_8,
s_z_loc_8=s_z_loc_8,
alpha=alpha)
s_loop_counter_8 = 0
s_loop_data_8 = {}
def slat_plot_array_8(data_array,pts_array,**kwargs):
global s_loop_counter_8,s_loop_data_8
ax = kwargs['axis']
#s_span_loc = kwargs['s_span_loc']
s_x_loc_8 = kwargs['s_x_loc_8']
s_y_loc_8 = kwargs['s_y_loc_8']
s_z_loc_8 = kwargs['s_z_loc_8']
cp_array = data_array.GetPointData()['cp']
chord_array = data_array.GetPointData()['chord']
ax.plot(chord_array, cp_array , 'b.',color='b',label='zCFD SST')
#s_loop_data[s_loop_counter] = (pts_array,cp_array)
s_loop_data_8[s_loop_counter_8] = (chord_array,cp_array)
s_loop_counter_8 += 1
#--------------9
def slat_plot_cp_profile_9(ax,file_root,s_x_loc_9,s_y_loc_9,s_z_loc_9):
force_data = cp_profile_wall_from_file(file_root,
[0.003861,0.999926,0.011494], # the normal of the plane ----constant for the slat
[s_x_loc_9,s_y_loc_9,s_z_loc_9], # definition of the points
func=slat_plot_array_9,
axis=ax,
s_x_loc_9=s_x_loc_9,
s_y_loc_9=s_y_loc_9,
s_z_loc_9=s_z_loc_9,
alpha=alpha)
s_loop_counter_9 = 0
s_loop_data_9 = {}
def slat_plot_array_9(data_array,pts_array,**kwargs):
global s_loop_counter_9,s_loop_data_9
ax = kwargs['axis']
#s_span_loc = kwargs['s_span_loc']
s_x_loc_9 = kwargs['s_x_loc_9']
s_y_loc_9 = kwargs['s_y_loc_9']
s_z_loc_9 = kwargs['s_z_loc_9']
cp_array = data_array.GetPointData()['cp']
chord_array = data_array.GetPointData()['chord']
ax.plot(chord_array, cp_array , 'b.',color='b',label='zCFD SST')
#s_loop_data[s_loop_counter] = (pts_array,cp_array)
s_loop_data_9[s_loop_counter_9] = (chord_array,cp_array)
s_loop_counter_9 += 1
#------------------10
def slat_plot_cp_profile_10(ax,file_root,s_x_loc,s_y_loc,s_z_loc):
force_data = cp_profile_wall_from_file(file_root,
[0.003861,0.999926,0.011494], # the normal of the plane ----constant for the slat
[s_x_loc_10,s_y_loc_10,s_z_loc_10], # definition of the points
func=slat_plot_array_10,
axis=ax,
s_x_loc_10=s_x_loc_10,
s_y_loc_10=s_y_loc_10,
s_z_loc_10=s_z_loc_10,
alpha=alpha)
s_loop_counter_10 = 0
s_loop_data_10 = {}
def slat_plot_array_10(data_array,pts_array,**kwargs):
global s_loop_counter_10,s_loop_data_10
ax = kwargs['axis']
#s_span_loc = kwargs['s_span_loc']
s_x_loc_10 = kwargs['s_x_loc_10']
s_y_loc_10 = kwargs['s_y_loc_10']
s_z_loc_10 = kwargs['s_z_loc_10']
cp_array = data_array.GetPointData()['cp']
chord_array = data_array.GetPointData()['chord']
ax.plot(chord_array, cp_array , 'b.',color='b',label='zCFD SST')
#s_loop_data[s_loop_counter] = (pts_array,cp_array)
s_loop_data_10[s_loop_counter_10] = (chord_array,cp_array)
s_loop_counter_10 += 1
#--------------------11
def slat_plot_cp_profile_11(ax,file_root,s_x_loc,s_y_loc,s_z_loc):
force_data = cp_profile_wall_from_file(file_root,
[0.003861,0.999926,0.011494], # the normal of the plane ----constant for the slat
[s_x_loc_11,s_y_loc_11,s_z_loc_11], # definition of the points
func=slat_plot_array_11,
axis=ax,
s_x_loc_11=s_x_loc_11,
s_y_loc_11=s_y_loc_11,
s_z_loc_11=s_z_loc_11,
alpha=alpha)
s_loop_counter_11 = 0
s_loop_data_11 = {}
def slat_plot_array_11(data_array,pts_array,**kwargs):
global s_loop_counter_11,s_loop_data_11
ax = kwargs['axis']
#s_span_loc = kwargs['s_span_loc']
s_x_loc_11 = kwargs['s_x_loc_11']
s_y_loc_11 = kwargs['s_y_loc_11']
s_z_loc_11 = kwargs['s_z_loc_11']
cp_array = data_array.GetPointData()['cp']
chord_array = data_array.GetPointData()['chord']
ax.plot(chord_array, cp_array , 'b.',color='b',label='zCFD SST')
#s_loop_data[s_loop_counter] = (pts_array,cp_array)
s_loop_data_11[s_loop_counter_11] = (chord_array,cp_array)
s_loop_counter_11 += 1
#----------------------------------------------------------------------
#------------------------------------FLAP------------------------------
#--------------1
def f_plot_cp_profile_1(f_ax,file_root,f_nx_1,f_ny_1,f_nz_1,f_x_loc_1,f_y_loc_1,f_z_loc_1):
force_data = cp_profile_wall_from_file(file_root,
[f_nx_1,f_ny_1,f_nz_1], # the normal of the plane -----to revise
[f_x_loc_1,f_y_loc_1,f_z_loc_1], # points definition
func=flap_plot_array_1,
axis=f_ax,
f_nx_1 = f_nx_1,
f_ny_1 = f_ny_1,
f_nz_1 = f_nz_1,
f_x_loc_1 = f_x_loc_1,
f_y_loc_1 = f_y_loc_1,
f_z_loc_1 = f_z_loc_1,
alpha=alpha)
f_loop_counter_1 = 0
f_loop_data_1 = {}
def flap_plot_array_1(data_array,pts_array,**kwargs):
global f_loop_counter_1,f_loop_data_1
f_ax = kwargs['axis']
f_nx_1 = kwargs['f_nx_1']
f_ny_1 = kwargs['f_ny_1']
f_nz_1 = kwargs['f_nz_1']
f_x_loc_1 = kwargs['f_x_loc_1']
f_y_loc_1 = kwargs['f_y_loc_1']
f_z_loc_1 = kwargs['f_z_loc_1']
cp_array = data_array.GetPointData()['cp']
chord_array = data_array.GetPointData()['chord']
f_ax.plot(chord_array, cp_array , 'b.',color='b',label='zCFD SST')
f_loop_data_1[f_loop_counter_1] = (chord_array,cp_array)
f_loop_counter_1 += 1
#---------------2
def f_plot_cp_profile_2(f_ax,file_root,f_nx_2,f_ny_2,f_nz_2,f_x_loc_2,f_y_loc_2,f_z_loc_2):
force_data = cp_profile_wall_from_file(file_root,
[f_nx_2,f_ny_2,f_nz_2], # the normal of the plane -----to revise
[f_x_loc_2,f_y_loc_2,f_z_loc_2], # points definition
func=flap_plot_array_2,
axis=f_ax,
f_nx_2 = f_nx_2,
f_ny_2 = f_ny_2,
f_nz_2 = f_nz_2,
f_x_loc_2 = f_x_loc_2,
f_y_loc_2 = f_y_loc_2,
f_z_loc_2 = f_z_loc_2,
alpha=alpha)
f_loop_counter_2 = 0
f_loop_data_2 = {}
def flap_plot_array_2(data_array,pts_array,**kwargs):
global f_loop_counter_2,f_loop_data_2
f_ax = kwargs['axis']
f_nx_2 = kwargs['f_nx_2']
f_ny_2 = kwargs['f_ny_2']
f_nz_2 = kwargs['f_nz_2']
f_x_loc_2 = kwargs['f_x_loc_2']
f_y_loc_2 = kwargs['f_y_loc_2']
f_z_loc_2 = kwargs['f_z_loc_2']
cp_array = data_array.GetPointData()['cp']
chord_array = data_array.GetPointData()['chord']
f_ax.plot(chord_array, cp_array , 'b.',color='b',label='zCFD SST')
f_loop_data_2[f_loop_counter_2] = (chord_array,cp_array)
f_loop_counter_2 += 1
#---------------4
def f_plot_cp_profile_4(f_ax,file_root,f_nx_4,f_ny_4,f_nz_4,f_x_loc_4,f_y_loc_4,f_z_loc_4):
force_data = cp_profile_wall_from_file(file_root,
[f_nx_4,f_ny_4,f_nz_4], # the normal of the plane -----to revise
[f_x_loc_4,f_y_loc_4,f_z_loc_4], # points definition
func=flap_plot_array_4,
axis=f_ax,
f_nx_4 = f_nx_4,
f_ny_4 = f_ny_4,
f_nz_4 = f_nz_4,
f_x_loc_4 = f_x_loc_4,
f_y_loc_4 = f_y_loc_4,
f_z_loc_4 = f_z_loc_4,
alpha=alpha)
f_loop_counter_4 = 0
f_loop_data_4 = {}
def flap_plot_array_4(data_array,pts_array,**kwargs):
global f_loop_counter_4,f_loop_data_4
f_ax = kwargs['axis']
f_nx_4 = kwargs['f_nx_4']
f_ny_4 = kwargs['f_ny_4']
f_nz_4 = kwargs['f_nz_4']
f_x_loc_4 = kwargs['f_x_loc_4']
f_y_loc_4 = kwargs['f_y_loc_4']
f_z_loc_4 = kwargs['f_z_loc_4']
cp_array = data_array.GetPointData()['cp']
chord_array = data_array.GetPointData()['chord']
f_ax.plot(chord_array, cp_array , 'b.',color='b',label='zCFD SST')
f_loop_data_4[f_loop_counter_4] = (chord_array,cp_array)
f_loop_counter_4 += 1
#---------------5
def f_plot_cp_profile_5(f_ax,file_root,f_nx_5,f_ny_5,f_nz_5,f_x_loc_5,f_y_loc_5,f_z_loc_5):
force_data = cp_profile_wall_from_file(file_root,
[f_nx_5,f_ny_5,f_nz_5], # the normal of the plane -----to revise
[f_x_loc_5,f_y_loc_5,f_z_loc_5], # points definition
func=flap_plot_array_5,
axis=f_ax,
f_nx_5 = f_nx_1,
f_ny_5 = f_ny_5,
f_nz_5 = f_nz_5,
f_x_loc_5 = f_x_loc_5,
f_y_loc_5 = f_y_loc_5,
f_z_loc_5 = f_z_loc_5,
alpha=alpha)
f_loop_counter_5 = 0
f_loop_data_5 = {}
def flap_plot_array_5(data_array,pts_array,**kwargs):
global f_loop_counter_5,f_loop_data_5
f_ax = kwargs['axis']
f_nx_5 = kwargs['f_nx_5']
f_ny_5 = kwargs['f_ny_5']
f_nz_5 = kwargs['f_nz_5']
f_x_loc_5 = kwargs['f_x_loc_5']
f_y_loc_5 = kwargs['f_y_loc_5']
f_z_loc_5 = kwargs['f_z_loc_5']
cp_array = data_array.GetPointData()['cp']
chord_array = data_array.GetPointData()['chord']
f_ax.plot(chord_array, cp_array , 'b.',color='b',label='zCFD SST')
f_loop_data_5[f_loop_counter_5] = (chord_array,cp_array)
f_loop_counter_5 += 1
#---------------6
def f_plot_cp_profile_6(f_ax,file_root,f_nx_6,f_ny_6,f_nz_6,f_x_loc_6,f_y_loc_6,f_z_loc_6):
force_data = cp_profile_wall_from_file(file_root,
[f_nx_6,f_ny_6,f_nz_6], # the normal of the plane -----to revise
[f_x_loc_6,f_y_loc_6,f_z_loc_6], # points definition
func=flap_plot_array_6,
axis=f_ax,
f_nx_6 = f_nx_6,
f_ny_6 = f_ny_6,
f_nz_6 = f_nz_6,
f_x_loc_6 = f_x_loc_6,
f_y_loc_6 = f_y_loc_6,
f_z_loc_6 = f_z_loc_6,
alpha=alpha)
f_loop_counter_6 = 0
f_loop_data_6 = {}
def flap_plot_array_6(data_array,pts_array,**kwargs):
global f_loop_counter_6,f_loop_data_6
f_ax = kwargs['axis']
f_nx_6 = kwargs['f_nx_6']
f_ny_6 = kwargs['f_ny_6']
f_nz_6 = kwargs['f_nz_6']
f_x_loc_6 = kwargs['f_x_loc_6']
f_y_loc_6 = kwargs['f_y_loc_6']
f_z_loc_6 = kwargs['f_z_loc_6']
cp_array = data_array.GetPointData()['cp']
chord_array = data_array.GetPointData()['chord']
f_ax.plot(chord_array, cp_array , 'b.',color='b',label='zCFD SST')
f_loop_data_6[f_loop_counter_6] = (chord_array,cp_array)
f_loop_counter_6 += 1
#---------------7
def f_plot_cp_profile_7(f_ax,file_root,f_nx_7,f_ny_7,f_nz_7,f_x_loc_7,f_y_loc_7,f_z_loc_7):
force_data = cp_profile_wall_from_file(file_root,
[f_nx_7,f_ny_7,f_nz_7], # the normal of the plane -----to revise
[f_x_loc_7,f_y_loc_7,f_z_loc_7], # points definition
func=flap_plot_array_7,
axis=f_ax,
f_nx_7 = f_nx_7,
f_ny_7 = f_ny_7,
f_nz_7 = f_nz_7,
f_x_loc_7 = f_x_loc_7,
f_y_loc_7 = f_y_loc_7,
f_z_loc_7 = f_z_loc_7,
alpha=alpha)
f_loop_counter_7 = 0
f_loop_data_7 = {}
def flap_plot_array_7(data_array,pts_array,**kwargs):
global f_loop_counter_7,f_loop_data_7
f_ax = kwargs['axis']
f_nx_7 = kwargs['f_nx_7']
f_ny_7 = kwargs['f_ny_7']
f_nz_7 = kwargs['f_nz_7']
f_x_loc_7 = kwargs['f_x_loc_7']
f_y_loc_7 = kwargs['f_y_loc_7']
f_z_loc_7 = kwargs['f_z_loc_7']
cp_array = data_array.GetPointData()['cp']
chord_array = data_array.GetPointData()['chord']
f_ax.plot(chord_array, cp_array , 'b.',color='b',label='zCFD SST')
f_loop_data_7[f_loop_counter_7] = (chord_array,cp_array)
f_loop_counter_7 += 1
#---------------8
def f_plot_cp_profile_8(f_ax,file_root,f_nx_8,f_ny_8,f_nz_8,f_x_loc_8,f_y_loc_8,f_z_loc_8):
force_data = cp_profile_wall_from_file(file_root,
[f_nx_8,f_ny_8,f_nz_8], # the normal of the plane -----to revise
[f_x_loc_8,f_y_loc_8,f_z_loc_8], # points definition
func=flap_plot_array_8,
axis=f_ax,
f_nx_8 = f_nx_8,
f_ny_8 = f_ny_8,
f_nz_8 = f_nz_8,
f_x_loc_8 = f_x_loc_8,
f_y_loc_8 = f_y_loc_8,
f_z_loc_8 = f_z_loc_8,
alpha=alpha)
f_loop_counter_8 = 0
f_loop_data_8 = {}
def flap_plot_array_8(data_array,pts_array,**kwargs):
global f_loop_counter_8,f_loop_data_8
f_ax = kwargs['axis']
f_nx_8 = kwargs['f_nx_8']
f_ny_8 = kwargs['f_ny_8']
f_nz_8 = kwargs['f_nz_8']
f_x_loc_8 = kwargs['f_x_loc_8']
f_y_loc_8 = kwargs['f_y_loc_8']
f_z_loc_8 = kwargs['f_z_loc_8']
cp_array = data_array.GetPointData()['cp']
chord_array = data_array.GetPointData()['chord']
f_ax.plot(chord_array, cp_array , 'b.',color='b',label='zCFD SST')
f_loop_data_8[f_loop_counter_8] = (chord_array,cp_array)
f_loop_counter_8 += 1
#---------------9
def f_plot_cp_profile_9(f_ax,file_root,f_nx_9,f_ny_9,f_nz_9,f_x_loc_9,f_y_loc_9,f_z_loc_9):
force_data = cp_profile_wall_from_file(file_root,
[f_nx_9,f_ny_9,f_nz_9], # the normal of the plane -----to revise
[f_x_loc_9,f_y_loc_9,f_z_loc_9], # points definition
func=flap_plot_array_9,
axis=f_ax,
f_nx_9 = f_nx_9,
f_ny_9 = f_ny_9,
f_nz_9 = f_nz_9,
f_x_loc_9 = f_x_loc_9,
f_y_loc_9 = f_y_loc_9,
f_z_loc_9 = f_z_loc_9,
alpha=alpha)
f_loop_counter_9 = 0
f_loop_data_9 = {}
def flap_plot_array_9(data_array,pts_array,**kwargs):
global f_loop_counter_9,f_loop_data_9
f_ax = kwargs['axis']
f_nx_9 = kwargs['f_nx_9']
f_ny_9 = kwargs['f_ny_9']
f_nz_9 = kwargs['f_nz_9']
f_x_loc_9 = kwargs['f_x_loc_9']
f_y_loc_9 = kwargs['f_y_loc_9']
f_z_loc_9 = kwargs['f_z_loc_9']
cp_array = data_array.GetPointData()['cp']
chord_array = data_array.GetPointData()['chord']
f_ax.plot(chord_array, cp_array , 'b.',color='b',label='zCFD SST')
f_loop_data_9[f_loop_counter_9] = (chord_array,cp_array)
f_loop_counter_9 += 1
#---------------10
def f_plot_cp_profile_10(f_ax,file_root,f_nx_10,f_ny_10,f_nz_10,f_x_loc_10,f_y_loc_10,f_z_loc_10):
force_data = cp_profile_wall_from_file(file_root,
[f_nx_10,f_ny_10,f_nz_10], # the normal of the plane -----to revise
[f_x_loc_10,f_y_loc_10,f_z_loc_10], # points definition
func=flap_plot_array_10,
axis=f_ax,
f_nx_10 = f_nx_10,
f_ny_10 = f_ny_10,
f_nz_10 = f_nz_10,
f_x_loc_10 = f_x_loc_10,
f_y_loc_10 = f_y_loc_10,
f_z_loc_10 = f_z_loc_10,
alpha=alpha)
f_loop_counter_10 = 0
f_loop_data_10 = {}
def flap_plot_array_10(data_array,pts_array,**kwargs):
global f_loop_counter_10,f_loop_data_10
f_ax = kwargs['axis']
f_nx_10 = kwargs['f_nx_10']
f_ny_10 = kwargs['f_ny_10']
f_nz_10 = kwargs['f_nz_10']
f_x_loc_10 = kwargs['f_x_loc_10']
f_y_loc_10 = kwargs['f_y_loc_10']
f_z_loc_10 = kwargs['f_z_loc_10']
cp_array = data_array.GetPointData()['cp']
chord_array = data_array.GetPointData()['chord']
f_ax.plot(chord_array, cp_array , 'b.',color='b',label='zCFD SST')
f_loop_data_10[f_loop_counter_10] = (chord_array,cp_array)
f_loop_counter_10 += 1
#---------------11
def f_plot_cp_profile_11(f_ax,file_root,f_nx_11,f_ny_11,f_nz_11,f_x_loc_11,f_y_loc_11,f_z_loc_11):
force_data = cp_profile_wall_from_file(file_root,
[f_nx_11,f_ny_11,f_nz_11], # the normal of the plane -----to revise
[f_x_loc_11,f_y_loc_11,f_z_loc_11], # points definition
func=flap_plot_array_11,
axis=f_ax,
f_nx_11 = f_nx_11,
f_ny_11 = f_ny_11,
f_nz_11 = f_nz_11,
f_x_loc_11 = f_x_loc_11,
f_y_loc_11 = f_y_loc_11,
f_z_loc_11 = f_z_loc_11,
alpha=alpha)
f_loop_counter_11 = 0
f_loop_data_11 = {}
def flap_plot_array_11(data_array,pts_array,**kwargs):
global f_loop_counter_11,f_loop_data_11
f_ax = kwargs['axis']
f_nx_11 = kwargs['f_nx_11']
f_ny_11 = kwargs['f_ny_11']
f_nz_11 = kwargs['f_nz_11']
f_x_loc_11 = kwargs['f_x_loc_11']
f_y_loc_11 = kwargs['f_y_loc_11']
f_z_loc_11 = kwargs['f_z_loc_11']
cp_array = data_array.GetPointData()['cp']
chord_array = data_array.GetPointData()['chord']
f_ax.plot(chord_array, cp_array , 'b.',color='b',label='zCFD SST')
f_loop_data_11[f_loop_counter_11] = (chord_array,cp_array)
f_loop_counter_11 += 1
SLAT DATA SELECTION
In [10]:
from zutil.post import get_case_root


    # SLAT POSITIONS

s_x_loc_1 = 1128.5257830070 ; s_y_loc_1 =  213.764 ; s_z_loc_1 = -54.987 ;
s_x_loc_2 = 1252.6898829811 ; s_y_loc_2 =  407.515 ; s_z_loc_2 = -49.951 ;
s_x_loc_4 = 1393.4388029500 ; s_y_loc_4 =  632.53  ; s_z_loc_4 = -35.956 ;
s_x_loc_5 = 1475.6542901294 ; s_y_loc_5 =  763.513 ; s_z_loc_5 = -27.997 ;
s_x_loc_6 = 1596.4087811939 ; s_y_loc_6 =  955.929 ; s_z_loc_6 = -16.246 ;
s_x_loc_7 = 1626.6927045299 ; s_y_loc_7 =  1004.247 ; s_z_loc_7 = -13.28 ;
s_x_loc_8 = 1658.0724766097 ; s_y_loc_8 =  1054.277 ; s_z_loc_8 = -10.20 ;
s_x_loc_9 = 1717.2411764284 ; s_y_loc_9 =  1148.618 ; s_z_loc_9 =  -4.364 ;
s_x_loc_10 = 1781.1352303004 ; s_y_loc_10 = 1250.389 ; s_z_loc_10 =  1.984 ;
s_x_loc_11 = 1845.2888081300 ; s_y_loc_11 = 1352.433 ; s_z_loc_11 =  8.402 ;

fig1 = pl.figure(figsize=(20, 10),dpi=600, facecolor='w', edgecolor='k')
fig2 = pl.figure(figsize=(20, 10),dpi=600, facecolor='w', edgecolor='k')
fig4 = pl.figure(figsize=(20, 10),dpi=600, facecolor='w', edgecolor='k')
fig5 = pl.figure(figsize=(20, 10),dpi=600, facecolor='w', edgecolor='k')
fig6 = pl.figure(figsize=(20, 10),dpi=600, facecolor='w', edgecolor='k')
fig7 = pl.figure(figsize=(20, 10),dpi=600, facecolor='w', edgecolor='k')
fig8 = pl.figure(figsize=(20, 10),dpi=600, facecolor='w', edgecolor='k')
fig9 = pl.figure(figsize=(20, 10),dpi=600, facecolor='w', edgecolor='k')
fig10 = pl.figure(figsize=(20, 10),dpi=600, facecolor='w', edgecolor='k')
fig11 = pl.figure(figsize=(20, 10),dpi=600, facecolor='w', edgecolor='k')


fig1.suptitle('PS1', fontsize=30, fontweight='bold')
fig2.suptitle('PS2', fontsize=30, fontweight='bold')
fig4.suptitle('PS4', fontsize=30, fontweight='bold')
fig5.suptitle('PS5', fontsize=30, fontweight='bold')
fig6.suptitle('PS6', fontsize=30, fontweight='bold')
fig7.suptitle('PS7', fontsize=30, fontweight='bold')
fig8.suptitle('PS8', fontsize=30, fontweight='bold')
fig9.suptitle('PS9', fontsize=30, fontweight='bold')
fig10.suptitle('PS10', fontsize=30, fontweight='bold')
fig11.suptitle('PS11', fontsize=30, fontweight='bold')

ax = fig1.add_subplot(2,1,1)
ax2 = fig2.add_subplot(2,1,1)
ax4 = fig4.add_subplot(2,1,1)
ax5 = fig5.add_subplot(2,1,1)
ax6 = fig6.add_subplot(2,1,1)
ax7 = fig7.add_subplot(2,1,1)
ax8 = fig8.add_subplot(2,1,1)
ax9 = fig9.add_subplot(2,1,1)
ax10 = fig10.add_subplot(2,1,1)
ax11 = fig11.add_subplot(2,1,1)

ax.grid(True)
ax.set_xlabel('x/c')
ax.set_ylabel('Cp []')
ax.axis([0,1.1,-5,5])
ax2.axis([0,1.1,-5,5])
ax4.axis([0,1.1,-5,5])
ax5.axis([0,1.1,-5,5])
ax6.axis([0,1.1,-5,5])
ax7.axis([0,1.1,-5,5])
ax8.axis([0,1.1,-5,5])
ax9.axis([0,1.1,-5,5])
ax10.axis([0,1.1,-5,5])
ax11.axis([0,1.1,-5,5])

# SELECT THE LOOPS OF INTEREST AND NORMALIZE THEM
# PS 1
slat_plot_cp_profile_1(ax,get_case_root(case_name,num_procs),s_x_loc_1,s_y_loc_1,s_z_loc_1)
ax.plot(s_loop_data_1[2][0],s_loop_data_1[2][1], color='r', markersize=20)

slat_plot_cp_profile_2(ax2,get_case_root(case_name,num_procs),s_x_loc_2,s_y_loc_2,s_z_loc_2)
ax2.plot(s_loop_data_2[2][0],s_loop_data_2[2][1], color='r', markersize=20)

slat_plot_cp_profile_4(ax4,get_case_root(case_name,num_procs),s_x_loc_4,s_y_loc_4,s_z_loc_4)
ax4.plot(s_loop_data_4[2][0],s_loop_data_4[2][1], color='r', markersize=20)

# in this case the third block in the loop data dictionary is the slat
slat_plot_cp_profile_5(ax5,get_case_root(case_name,num_procs),s_x_loc_5,s_y_loc_5,s_z_loc_5)
ax5.plot(s_loop_data_5[2][0],s_loop_data_5[2][1], color='r', markersize=20)
# in this case the third block in the loop data dictionary is the slat
slat_plot_cp_profile_6(ax6,get_case_root(case_name,num_procs),s_x_loc_6,s_y_loc_6,s_z_loc_6)
ax6.plot(s_loop_data_6[2][0],s_loop_data_6[2][1], color='r', markersize=20)

slat_plot_cp_profile_7(ax7,get_case_root(case_name,num_procs),s_x_loc_7,s_y_loc_7,s_z_loc_7)
ax7.plot(s_loop_data_7[2][0],s_loop_data_7[2][1], color='r', markersize=20)

slat_plot_cp_profile_8(ax8,get_case_root(case_name,num_procs),s_x_loc_8,s_y_loc_8,s_z_loc_8)
ax8.plot(s_loop_data_8[2][0],s_loop_data_8[2][1], color='r', markersize=20)

slat_plot_cp_profile_9(ax9,get_case_root(case_name,num_procs),s_x_loc_9,s_y_loc_9,s_z_loc_9)
ax9.plot(s_loop_data_9[2][0],s_loop_data_9[2][1], color='r', markersize=20)

slat_plot_cp_profile_10(ax10,get_case_root(case_name,num_procs),s_x_loc_10,s_y_loc_10,s_z_loc_10)
ax10.plot(s_loop_data_10[2][0],s_loop_data_10[2][1], color='r', markersize=20)

slat_plot_cp_profile_11(ax11,get_case_root(case_name,num_procs),s_x_loc_10,s_y_loc_10,s_z_loc_10)
ax11.plot(s_loop_data_11[2][0],s_loop_data_11[2][1], color='r', markersize=20)

# SELECT THE LOOPS OF INTEREST AND NORMALIZE THEM
#ps1
s_min_loop_1 = min(s_loop_data_1[2][0]); s_max_loop_1 = max(s_loop_data_1[2][0]);
s_norm_loop_1 = np.zeros(len(s_loop_data_1[2][0])) ;
s_d1 = s_max_loop_1-s_min_loop_1 ;
for i in range (0,len(s_loop_data_1[2][0])):
    s_norm_loop_1[i] = (s_loop_data_1[2][0][i]-s_min_loop_1)/s_d1
#ps2
s_min_loop_2 = min(s_loop_data_2[2][0]); s_max_loop_2 = max(s_loop_data_2[2][0]);
s_norm_loop_2 = np.zeros(len(s_loop_data_2[2][0])) ;
s_d2 = s_max_loop_2-s_min_loop_2 ;
for j in range (0,len(s_loop_data_2[2][0])):
    s_norm_loop_2[j] = (s_loop_data_2[2][0][j]-s_min_loop_2)/s_d2
#ps4
s_min_loop_4 = min(s_loop_data_4[2][0]); s_max_loop_4 = max(s_loop_data_4[2][0]);
s_norm_loop_4 = np.zeros(len(s_loop_data_4[2][0])) ;
s_d4 = s_max_loop_4-s_min_loop_4 ;
for i in range (0,len(s_loop_data_4[2][0])):
    s_norm_loop_4[i] = (s_loop_data_4[2][0][i]-s_min_loop_4)/s_d4
#ps5
s_min_loop_5 = min(s_loop_data_5[2][0]); s_max_loop_5 = max(s_loop_data_5[2][0]);
s_norm_loop_5 = np.zeros(len(s_loop_data_5[2][0])) ;
s_d5 = s_max_loop_5-s_min_loop_5 ;
for i in range (0,len(s_loop_data_5[2][0])):
    s_norm_loop_5[i] = (s_loop_data_5[2][0][i]-s_min_loop_5)/s_d5
#ps6
s_min_loop_6 = min(s_loop_data_6[2][0]); s_max_loop_6 = max(s_loop_data_6[2][0]);
s_norm_loop_6 = np.zeros(len(s_loop_data_6[2][0])) ;
s_d6 = s_max_loop_6-s_min_loop_6 ;
for i in range (0,len(s_loop_data_6[2][0])):
    s_norm_loop_6[i] = (s_loop_data_6[2][0][i]-s_min_loop_6)/s_d6
#ps7
s_min_loop_7 = min(s_loop_data_7[2][0]); s_max_loop_7 = max(s_loop_data_7[2][0]);
s_norm_loop_7 = np.zeros(len(s_loop_data_7[2][0])) ;
s_d7 = s_max_loop_7-s_min_loop_7 ;
for i in range (0,len(s_loop_data_7[2][0])):
    s_norm_loop_7[i] = (s_loop_data_7[2][0][i]-s_min_loop_7)/s_d7
#ps8
s_min_loop_8 = min(s_loop_data_8[2][0]); s_max_loop_8 = max(s_loop_data_8[2][0]);
s_norm_loop_8 = np.zeros(len(s_loop_data_8[2][0])) ;
s_d8 = s_max_loop_8-s_min_loop_8 ;
for i in range (0,len(s_loop_data_8[2][0])):
    s_norm_loop_8[i] = (s_loop_data_8[2][0][i]-s_min_loop_8)/s_d8

#ps9
s_min_loop_9 = min(s_loop_data_9[2][0]); s_max_loop_9 = max(s_loop_data_9[2][0]);
s_norm_loop_9 = np.zeros(len(s_loop_data_9[2][0])) ;
s_d9 = s_max_loop_9-s_min_loop_9 ;
for i in range (0,len(s_loop_data_9[2][0])):
    s_norm_loop_9[i] = (s_loop_data_9[2][0][i]-s_min_loop_9)/s_d9
#ps10
s_min_loop_10 = min(s_loop_data_10[2][0]); s_max_loop_10 = max(s_loop_data_10[2][0]);
s_norm_loop_10 = np.zeros(len(s_loop_data_10[2][0])) ;
s_d10 = s_max_loop_10-s_min_loop_10 ;
for i in range (0,len(s_loop_data_10[2][0])):
    s_norm_loop_10[i] = (s_loop_data_10[2][0][i]-s_min_loop_10)/s_d10
#ps11
s_min_loop_11 = min(s_loop_data_11[2][0]); s_max_loop_11 = max(s_loop_data_11[2][0]);
s_norm_loop_11 = np.zeros(len(s_loop_data_11[2][0])) ;
s_d11 = s_max_loop_11-s_min_loop_11 ;
for i in range (0,len(s_loop_data_11[2][0])):
    s_norm_loop_11[i] = (s_loop_data_11[2][0][i]-s_min_loop_11)/s_d11

# the data is stored in loop_data
# For each loop calculate min/max x. Locate the vector in the matrix i.e [0][0] [0][1] .........

#min_loop_1 = min(s_loop_data[0][0])
#max_loop_1 = max(s_loop_data[0][0])
#print min_loop_1
#print max_loop_1

#norm_loop_1 = np.zeros(len(loop_data[0][0]))
# Normalise x coordinate
#distancee_l = max_loop_1 - min_loop_1
#print distancee_l
#for i in range(0,len(loop_data[0][0])-1):
#    norm_loop_1[i] = (loop_data[0][0][i] - min_loop_1)/(max_loop_1 - min_loop_1)

#print norm_loop_1
#print len(norm_loop_1)
#print loop_data[0][0]
//Applications/paraview.app/Contents/Python/paraview/vtk/numpy_interface/dataset_adapter.py:126: FutureWarning: comparison to `None` will result in an elementwise object comparison in the future.
  if array == None:


## WING DATA SELECTION
In [11]:
from zutil.post import get_case_root

w_span_loc_1 = 209.67 ; w_span_loc_2 = 403.87 ; w_span_loc_4 = 629.14 ; w_span_loc_5 = 760.30 ;w_span_loc_6 = 952.95 ;
w_span_loc_7 = 1001.28; w_span_loc_8 = 1051.35; w_span_loc_9 = 1145.79; w_span_loc_10 = 1247.68; w_span_loc_11 = 1348.83 ;


w_fig1 = pl.figure(figsize=(20, 15),dpi=600, facecolor='w', edgecolor='k')
w_fig2 = pl.figure(figsize=(20, 15),dpi=600, facecolor='w', edgecolor='k')
w_fig4 = pl.figure(figsize=(20, 15),dpi=600, facecolor='w', edgecolor='k')
w_fig5 = pl.figure(figsize=(20, 15),dpi=600, facecolor='w', edgecolor='k')
w_fig6 = pl.figure(figsize=(20, 15),dpi=600, facecolor='w', edgecolor='k')
w_fig7 = pl.figure(figsize=(20, 15),dpi=600, facecolor='w', edgecolor='k')
w_fig8 = pl.figure(figsize=(20, 15),dpi=600, facecolor='w', edgecolor='k')
w_fig9 = pl.figure(figsize=(20, 15),dpi=600, facecolor='w', edgecolor='k')
w_fig10 = pl.figure(figsize=(20, 15),dpi=600, facecolor='w', edgecolor='k')
w_fig11 = pl.figure(figsize=(20, 15),dpi=600, facecolor='w', edgecolor='k')


w_fig1.suptitle('PS1', fontsize=30, fontweight='bold')
w_fig2.suptitle('PS2', fontsize=30, fontweight='bold')
w_fig4.suptitle('PS4', fontsize=30, fontweight='bold')
w_fig5.suptitle('PS5', fontsize=30, fontweight='bold')
w_fig6.suptitle('PS6', fontsize=30, fontweight='bold')
w_fig7.suptitle('PS7', fontsize=30, fontweight='bold')
w_fig8.suptitle('PS8', fontsize=30, fontweight='bold')
w_fig9.suptitle('PS9', fontsize=30, fontweight='bold')
w_fig10.suptitle('PS10', fontsize=30, fontweight='bold')
w_fig11.suptitle('PS11', fontsize=30, fontweight='bold')

w_ax =w_fig1.add_subplot(2,1,1)
w_ax2 = w_fig2.add_subplot(2,1,1)
w_ax4 = w_fig4.add_subplot(2,1,1)
w_ax5 = w_fig5.add_subplot(2,1,1)
w_ax6 = w_fig6.add_subplot(2,1,1)
w_ax7 = w_fig7.add_subplot(2,1,1)
w_ax8 = w_fig8.add_subplot(2,1,1)
w_ax9 = w_fig9.add_subplot(2,1,1)
w_ax10 = w_fig10.add_subplot(2,1,1)
w_ax11 = w_fig11.add_subplot(2,1,1)

w_ax.grid(True)
w_ax.set_xlabel('x/c')
w_ax.set_ylabel('Cp []')
w_ax.axis([0,1.1,-5,5])
w_ax2.axis([0,1.1,-5,5])
w_ax4.axis([0,1.1,-5,5])
w_ax5.axis([0,1.1,-5,5])
w_ax6.axis([0,1.1,-5,5])
w_ax7.axis([0,1.1,-5,5])
w_ax8.axis([0,1.1,-5,5])
w_ax9.axis([0,1.1,-5,5])
w_ax10.axis([0,1.1,-5,5])
w_ax11.axis([0,1.1,-5,5])

# the wing is in the 0th loop for the 6 9 10

wing_plot_cp_profile_1(w_ax,get_case_root(case_name,num_procs),w_span_loc_1)
w_ax.plot(w_loop_data_1[1][0],w_loop_data_1[1][1], color='r', markersize=20)

wing_plot_cp_profile_2(w_ax2,get_case_root(case_name,num_procs),w_span_loc_2)
w_ax2.plot(w_loop_data_2[1][0],w_loop_data_2[1][1], color='r', markersize=20)

wing_plot_cp_profile_4(w_ax4,get_case_root(case_name,num_procs),w_span_loc_4)
w_ax4.plot(w_loop_data_4[1][0],w_loop_data_4[1][1], color='r', markersize=20)

wing_plot_cp_profile_5(w_ax5,get_case_root(case_name,num_procs),w_span_loc_5)
w_ax5.plot(w_loop_data_5[1][0],w_loop_data_5[1][1], color='r', markersize=20)

wing_plot_cp_profile_6(w_ax6,get_case_root(case_name,num_procs),w_span_loc_6)
w_ax6.plot(w_loop_data_6[1][0],w_loop_data_6[1][1], color='r', markersize=20)

wing_plot_cp_profile_7(w_ax7,get_case_root(case_name,num_procs),w_span_loc_7)
w_ax7.plot(w_loop_data_7[1][0],w_loop_data_7[1][1], color='r', markersize=20)

wing_plot_cp_profile_8(w_ax8,get_case_root(case_name,num_procs),w_span_loc_8)
w_ax8.plot(w_loop_data_8[1][0],w_loop_data_8[1][1], color='r', markersize=20)

wing_plot_cp_profile_9(w_ax9,get_case_root(case_name,num_procs),w_span_loc_9)
w_ax9.plot(w_loop_data_9[1][0],w_loop_data_9[1][1], color='r', markersize=20)

wing_plot_cp_profile_10(w_ax10,get_case_root(case_name,num_procs),w_span_loc_10)
w_ax10.plot(w_loop_data_10[1][0],w_loop_data_10[1][1], color='r', markersize=20)

wing_plot_cp_profile_11(w_ax11,get_case_root(case_name,num_procs),w_span_loc_11)
w_ax11.plot(w_loop_data_11[1][0],w_loop_data_11[1][1], color='r', markersize=20)


# SELECT THE LOOPS OF INTEREST AND NORMALIZE THEM
# the wing is in the 0th loop for the 6 9 10

#ps1
w_min_loop_1 = min(w_loop_data_1[1][0]); w_max_loop_1 = max(w_loop_data_1[1][0]);
w_norm_loop_1 = np.zeros(len(w_loop_data_1[1][0])) ;
w_d1 = w_max_loop_1-w_min_loop_1 ;
for i in range (0,len(w_loop_data_1[1][0])):
    w_norm_loop_1[i] = (w_loop_data_1[1][0][i]-w_min_loop_1)/w_d1
#ps2
w_min_loop_2 = min(w_loop_data_2[1][0]); w_max_loop_2 = max(w_loop_data_1[1][0]);
w_norm_loop_2 = np.zeros(len(w_loop_data_2[1][0])) ;
w_d2 = w_max_loop_2-w_min_loop_2 ;
for i in range (0,len(w_loop_data_2[1][0])):
    w_norm_loop_2[i] = (w_loop_data_2[1][0][i]-w_min_loop_2)/w_d2
#ps4
w_min_loop_4 = min(w_loop_data_4[1][0]); w_max_loop_4 = max(w_loop_data_4[1][0]);
w_norm_loop_4 = np.zeros(len(w_loop_data_4[1][0])) ;
w_d4 = w_max_loop_4-w_min_loop_4 ;
for i in range (0,len(w_loop_data_4[1][0])):
    w_norm_loop_4[i] = (w_loop_data_4[1][0][i]-w_min_loop_4)/w_d4
#ps5
w_min_loop_5 = min(w_loop_data_5[1][0]); w_max_loop_5 = max(w_loop_data_5[1][0]);
w_norm_loop_5 = np.zeros(len(w_loop_data_5[1][0])) ;
w_d5 = w_max_loop_5-w_min_loop_5 ;
for i in range (0,len(w_loop_data_5[1][0])):
    w_norm_loop_5[i] = (w_loop_data_5[1][0][i]-w_min_loop_5)/w_d5
#ps6
w_min_loop_6 = min(w_loop_data_6[1][0]); w_max_loop_6 = max(w_loop_data_6[1][0]);
w_norm_loop_6 = np.zeros(len(w_loop_data_6[1][0])) ;
w_d6 = w_max_loop_6-w_min_loop_6 ;
for i in range (0,len(w_loop_data_6[1][0])):
    w_norm_loop_6[i] = (w_loop_data_6[1][0][i]-w_min_loop_6)/w_d6
#ps7
w_min_loop_7 = min(w_loop_data_7[1][0]); w_max_loop_7 = max(w_loop_data_7[1][0]);
w_norm_loop_7 = np.zeros(len(w_loop_data_7[1][0])) ;
w_d7 = w_max_loop_7-w_min_loop_7 ;
for i in range (0,len(w_loop_data_7[1][0])):
    w_norm_loop_7[i] = (w_loop_data_7[1][0][i]-w_min_loop_7)/w_d7
#ps8
w_min_loop_8 = min(w_loop_data_8[1][0]); w_max_loop_8 = max(w_loop_data_8[1][0]);
w_norm_loop_8 = np.zeros(len(w_loop_data_8[1][0])) ;
w_d8 = w_max_loop_8-w_min_loop_8 ;
for i in range (0,len(w_loop_data_8[1][0])):
    w_norm_loop_8[i] = (w_loop_data_8[1][0][i]-w_min_loop_8)/w_d8
#ps9
w_min_loop_9 = min(w_loop_data_9[1][0]); w_max_loop_9 = max(w_loop_data_9[1][0]);
w_norm_loop_9 = np.zeros(len(w_loop_data_9[1][0])) ;
w_d9 = w_max_loop_9-w_min_loop_9 ;
for i in range (0,len(w_loop_data_9[1][0])):
    w_norm_loop_9[i] = (w_loop_data_9[1][0][i]-w_min_loop_9)/w_d9
#ps10
w_min_loop_10 = min(w_loop_data_10[1][0]); w_max_loop_10 = max(w_loop_data_10[1][0]);
w_norm_loop_10 = np.zeros(len(w_loop_data_10[1][0])) ;
w_d10 = w_max_loop_10-w_min_loop_10 ;
for i in range (0,len(w_loop_data_10[1][0])):
    w_norm_loop_10[i] = (w_loop_data_10[1][0][i]-w_min_loop_10)/w_d10
#ps11
w_min_loop_11 = min(w_loop_data_11[1][0]); w_max_loop_11 = max(w_loop_data_11[1][0]);
w_norm_loop_11 = np.zeros(len(w_loop_data_11[1][0])) ;
w_d11 = w_max_loop_11-w_min_loop_11 ;
for i in range (0,len(w_loop_data_11[1][0])):
    w_norm_loop_11[i] = (w_loop_data_11[1][0][i]-w_min_loop_11)/w_d11


## FLAPS DATA SELECTION
In [14]:
print w_norm_loop_2
[  2.81497583e-02   2.96322890e-02   3.22782793e-02   3.33181348e-02
   3.48861823e-02   3.72418467e-02   3.77506357e-02   3.94264775e-02
   4.09797931e-02   4.15245136e-02   4.36358442e-02   4.39426986e-02
   4.57917299e-02   4.71923369e-02   4.80884668e-02   5.06169613e-02
   5.15892657e-02   5.32554060e-02   5.59437954e-02   5.63120926e-02
   5.86954242e-02   6.03206026e-02   6.15275393e-02   6.38192457e-02
   6.44469678e-02   6.70088786e-02   6.74616145e-02   7.03052277e-02
   7.06095669e-02   7.39418475e-02   7.40967120e-02   7.74009660e-02
   7.88892458e-02   8.08493051e-02   8.40461242e-02   8.49030888e-02
   8.88135061e-02   9.24080861e-02   9.60723730e-02   9.98070856e-02
   1.03624440e-01   1.05450116e-01   1.07514736e-01   1.11613793e-01
   1.13891487e-01   1.16132889e-01   1.20886258e-01   1.22979982e-01
   1.25706459e-01   1.30594929e-01   1.34931493e-01   1.35600177e-01
   1.40744120e-01   1.42350974e-01   1.49325623e-01   1.49848785e-01
   1.56729653e-01   1.58523350e-01   1.63922766e-01   1.68756261e-01
   1.70955624e-01   1.77699594e-01   1.83912497e-01   1.90214510e-01
   1.93323297e-01   1.98217517e-01   2.01282827e-01   2.09423451e-01
   2.13420104e-01   2.17838232e-01   2.26529685e-01   2.29184658e-01
   2.35351569e-01   2.43769943e-01   2.45861512e-01   2.50742437e-01
   2.53403518e-01   2.60990080e-01   2.62397155e-01   2.70954583e-01
   2.71853588e-01   2.81310739e-01   2.86566070e-01   2.91813855e-01
   3.02343560e-01   3.13218206e-01   3.24437076e-01   3.35864348e-01
   3.47212211e-01   3.59507587e-01   3.72787483e-01   3.85866882e-01
   3.99473395e-01   4.13754700e-01   4.28370527e-01   4.44439780e-01
   4.59556131e-01   4.69585311e-01   4.87148234e-01   5.00078517e-01
   5.02143497e-01   5.20191134e-01   5.23918301e-01   5.39830893e-01
   5.41737055e-01   5.56737708e-01   5.71163457e-01   5.85433983e-01
   5.99634083e-01   6.13772022e-01   6.28130580e-01   6.43367302e-01
   6.47996707e-01   6.58975914e-01   6.74001718e-01   6.75884525e-01
   6.87834958e-01   6.99026879e-01   7.01161565e-01   7.12040883e-01
   7.22415364e-01   7.27235925e-01   7.35383376e-01   7.36769610e-01
   7.44632484e-01   7.49388009e-01   7.51232728e-01   7.55674931e-01
   7.59707874e-01   7.59772191e-01   7.63235981e-01   7.66051568e-01
   7.66471247e-01   7.69231140e-01   7.69598718e-01   7.71677711e-01
   7.73930611e-01   7.75926961e-01   7.77698381e-01   7.79305953e-01
   7.80767284e-01   7.82090279e-01   7.83334584e-01   7.84554097e-01
   7.85771813e-01   7.86992404e-01   7.88219103e-01   7.89440771e-01
   7.90653098e-01   7.91862190e-01   7.91887701e-01   7.91900277e-01
   7.91908542e-01   7.91989028e-01   7.92146408e-01   7.92208928e-01
   7.92598066e-01   7.93159674e-01   7.93881536e-01   7.94778744e-01
   7.96090960e-01   7.97645353e-01   7.98867022e-01   7.98952179e-01
   8.00685152e-01   8.03279401e-01   8.06113672e-01   8.06810742e-01
   8.10847997e-01   8.12337355e-01   8.16062007e-01   8.18616012e-01
   8.21802052e-01   8.26781070e-01   8.27856138e-01   8.34384879e-01
   8.38909723e-01   8.41892751e-01   8.50237825e-01   8.58113994e-01
   8.59707193e-01   8.69650497e-01   8.77741895e-01   8.81052617e-01
   8.84893327e-01   8.88904712e-01   8.97597602e-01   9.00953238e-01
   9.08561358e-01   9.16561491e-01   9.24450954e-01   9.27497580e-01
   9.31506090e-01   9.38199756e-01   9.38702436e-01   9.43447900e-01
   9.47508151e-01   9.51587446e-01   9.55690097e-01   9.58129841e-01
   9.59862813e-01   9.59747114e-01   9.55262153e-01   9.50851930e-01
   9.46442785e-01   9.42023938e-01   9.40469903e-01   9.37474660e-01
   9.32328201e-01   9.32150700e-01   9.26382628e-01   9.19396480e-01
   9.17157234e-01   9.11593252e-01   9.03142899e-01   8.94064105e-01
   8.82966684e-01   8.81822627e-01   8.69734936e-01   8.59169300e-01
   8.52415988e-01   8.48504493e-01   8.40016771e-01   8.33244056e-01
   8.27604259e-01   8.21909846e-01   8.15607474e-01   8.11207671e-01
   8.09185091e-01   8.02842116e-01   7.96561662e-01   7.90246713e-01
   7.83841218e-01   7.83800256e-01   7.77153301e-01   7.70301537e-01
   7.63243527e-01   7.61043445e-01   7.55950166e-01   7.47864157e-01
   7.41943376e-01   7.36675829e-01   7.30558863e-01   7.20552320e-01
   7.11218413e-01   6.95362592e-01   6.94740260e-01   6.79351548e-01
   6.68176515e-01   6.64247773e-01   6.51752619e-01   6.40519017e-01
   6.27184865e-01   6.13955991e-01   6.12775284e-01   5.96678364e-01
   5.88289813e-01   5.79785563e-01   5.65199559e-01   5.54960180e-01
   5.48754463e-01   5.34016469e-01   5.26623938e-01   5.18864186e-01
   5.03058311e-01   4.92256605e-01   4.87039002e-01   4.70945675e-01
   4.55976283e-01   4.41170379e-01   4.38393599e-01   4.26247339e-01
   4.12038974e-01   3.97005624e-01   3.87863232e-01   3.80675509e-01
   3.64554156e-01   3.63700066e-01   3.49383548e-01   3.41465698e-01
   3.35192790e-01   3.25678866e-01   3.21323259e-01   3.13455354e-01
   3.07169151e-01   3.02866721e-01   2.93228835e-01   2.92796220e-01
   2.84221544e-01   2.81112398e-01   2.75397864e-01   2.70990156e-01
   2.66181812e-01   2.61494557e-01   2.55541438e-01   2.52299346e-01
   2.43165577e-01   2.40259083e-01   2.33970006e-01   2.24886900e-01
   2.23955198e-01   2.16057470e-01   2.08306702e-01   2.07497886e-01
   1.99119755e-01   1.94961051e-01   1.91575592e-01   1.85731705e-01
   1.84185576e-01   1.77548682e-01   1.76314796e-01   1.71649819e-01
   1.69145758e-01   1.66352449e-01   1.62917764e-01   1.61623514e-01
   1.57391151e-01   1.53532834e-01   1.49928553e-01   1.46440689e-01
   1.44369601e-01   1.42986601e-01   1.39538621e-01   1.36091000e-01
   1.33914993e-01   1.32643380e-01   1.29196119e-01   1.25749217e-01
   1.25541893e-01   1.22303393e-01   1.18857210e-01   1.17202568e-01
   1.15412105e-01   1.11966999e-01   1.08865758e-01   1.08522613e-01
   1.05093677e-01   1.01693486e-01   1.00598655e-01   9.83080265e-02
   9.49258012e-02   9.31594122e-02   9.15327965e-02   8.80452921e-02
   8.73726558e-02   8.43145320e-02   8.14734340e-02   8.01676860e-02
   7.82018776e-02   7.45523225e-02   7.14679687e-02   7.10590691e-02
   6.78004479e-02   6.39299145e-02   6.37412745e-02   6.00874077e-02
   5.82311901e-02   5.69505940e-02   5.40635038e-02   5.13636164e-02
   5.12989398e-02   4.85638395e-02   4.74061289e-02   4.58714977e-02
   4.32596422e-02   4.31572376e-02   4.07451609e-02   3.89295459e-02
   3.83715308e-02   3.61822289e-02   3.48046180e-02   3.41337782e-02
   3.21280859e-02   3.06671141e-02   3.00702931e-02   2.78619476e-02
   2.61559234e-02   2.54595723e-02   2.36421607e-02   2.18804428e-02
   2.01654358e-02   1.89437672e-02   1.84849229e-02   1.67806953e-02
   1.49719072e-02   1.30682602e-02   1.13065423e-02   1.11631759e-02
   9.67130304e-03   7.90850720e-03   5.95922726e-03   5.19496580e-03
   4.23128491e-03   2.82959992e-03   2.03335949e-03   1.74950121e-03
   9.15532774e-04   3.09010277e-04   0.00000000e+00   3.12603420e-05
   4.51658044e-04   1.35425550e-03   2.81486803e-03   4.71096947e-03
   6.54922130e-03   6.96171409e-03   9.54805824e-03   1.03683727e-02
   1.18562931e-02   1.43175959e-02   1.45583365e-02   1.68683680e-02
   1.90393448e-02   1.94518376e-02   2.20320734e-02   2.35961685e-02
   2.45943435e-02   2.71145739e-02   2.81497583e-02]
In [12]:
from zutil.post import get_case_root
# normals
f_nx_1 = 0.003629 ; f_ny_1 = 0.996368 ; f_nz_1 = 0.085077 ;
f_nx_2 = 0.003626 ; f_ny_2 = 0.996367 ; f_nz_2 = 0.085081 ;
f_nx_4 = 0.000246 ; f_ny_4 = 0.989663 ; f_nz_4 = 0.143413 ;
f_nx_5 = 0.000241 ; f_ny_5 = 0.989664 ; f_nz_5 = 0.143404 ;
f_nx_6 = 0.000247 ; f_ny_6 = 0.989663 ; f_nz_6 = 0.143415 ;
f_nx_7 = 0.000229 ; f_ny_7 = 0.989666 ; f_nz_7 = 0.143389 ;
f_nx_8 = 0.000244 ; f_ny_8 = 0.990009 ; f_nz_8 = 0.141001 ;
f_nx_9 = 0.000193 ; f_ny_9 = 0.990019 ; f_nz_9 = 0.140931 ;
f_nx_10 = 0.000301 ; f_ny_10 = 0.989998 ; f_nz_10 = 0.141080 ;
f_nx_11 = 0.000256 ; f_ny_11 = 0.990007 ; f_nz_11 = 0.141018 ;
# points which define the cutting planes nebdeac
f_x_loc_1 = 1633.0167311083 ; f_y_loc_1 = 213.9810000000 ; f_z_loc_1 = -110.2460000000;
f_x_loc_2 = 1652.6042432698 ; f_y_loc_2 = 407.4420000000 ; f_z_loc_2 = -91.5960000000;
f_x_loc_4 = 1668.8232828954 ; f_y_loc_4 = 633.7100000000 ; f_z_loc_4 = -67.7010000000;
f_x_loc_5 = 1719.6203614083 ; f_y_loc_5 = 764.5860000000 ; f_z_loc_5 = -54.8240000000;
f_x_loc_6 = 1793.8206003685 ; f_y_loc_6 = 956.6800000000 ; f_z_loc_6 = -34.7680000000;
f_x_loc_7 = 1809.4990162299 ; f_y_loc_7 = 1004.9670000000 ; f_z_loc_7 = -30.0750000000;
f_x_loc_8 = 1829.0543532948 ; f_y_loc_8 = 1053.2090000000 ; f_z_loc_8 = -21.8780000000;
f_x_loc_9 = 1855.0727180180 ; f_y_loc_9 = 1147.3930000000 ; f_z_loc_9 = -12.1070000000;
f_x_loc_10 = 1916.7026744926 ; f_y_loc_10 = 1249.1220000000 ; f_z_loc_10 = -2.459000000 ;
f_x_loc_11 = 1949.5082093248 ; f_y_loc_11 = 1351.2150000000 ; f_z_loc_11 = 6.5750000000 ;


f_fig1 = pl.figure(figsize=(20, 10),dpi=600, facecolor='w', edgecolor='k')
f_fig2 = pl.figure(figsize=(20, 10),dpi=600, facecolor='w', edgecolor='k')
f_fig4 = pl.figure(figsize=(20, 10),dpi=600, facecolor='w', edgecolor='k')
f_fig5 = pl.figure(figsize=(20, 10),dpi=600, facecolor='w', edgecolor='k')
f_fig6 = pl.figure(figsize=(20, 10),dpi=600, facecolor='w', edgecolor='k')
f_fig7 = pl.figure(figsize=(20, 10),dpi=600, facecolor='w', edgecolor='k')
f_fig8 = pl.figure(figsize=(20, 10),dpi=600, facecolor='w', edgecolor='k')
f_fig9 = pl.figure(figsize=(20, 10),dpi=600, facecolor='w', edgecolor='k')
f_fig10 = pl.figure(figsize=(20, 10),dpi=600, facecolor='w', edgecolor='k')
f_fig11 = pl.figure(figsize=(20, 10),dpi=600, facecolor='w', edgecolor='k')


f_fig1.suptitle('PS1', fontsize=30, fontweight='bold')
f_fig2.suptitle('PS2', fontsize=30, fontweight='bold')
f_fig4.suptitle('PS4', fontsize=30, fontweight='bold')
f_fig5.suptitle('PS5', fontsize=30, fontweight='bold')
f_fig6.suptitle('PS6', fontsize=30, fontweight='bold')
f_fig7.suptitle('PS7', fontsize=30, fontweight='bold')
f_fig8.suptitle('PS8', fontsize=30, fontweight='bold')
f_fig9.suptitle('PS9', fontsize=30, fontweight='bold')
f_fig10.suptitle('PS10', fontsize=30, fontweight='bold')
f_fig11.suptitle('PS11', fontsize=30, fontweight='bold')

f_ax =f_fig1.add_subplot(2,1,1)
f_ax2 = f_fig2.add_subplot(2,1,1)
f_ax4 = f_fig4.add_subplot(2,1,1)
f_ax5 = f_fig5.add_subplot(2,1,1)
f_ax6 = f_fig6.add_subplot(2,1,1)
f_ax7 = f_fig7.add_subplot(2,1,1)
f_ax8 = f_fig8.add_subplot(2,1,1)
f_ax9 = f_fig9.add_subplot(2,1,1)
f_ax10 = f_fig10.add_subplot(2,1,1)
f_ax11 = f_fig11.add_subplot(2,1,1)

f_ax.grid(True)
f_ax.set_xlabel('x/c')
f_ax.set_ylabel('Cp []')
f_ax.axis([0,1.1,-5,5])
f_ax2.axis([0,1.1,-5,5])
f_ax4.axis([0,1.1,-5,5])
f_ax5.axis([0,1.1,-5,5])
f_ax6.axis([0,1.1,-5,5])
f_ax7.axis([0,1.1,-5,5])
f_ax8.axis([0,1.1,-5,5])
f_ax9.axis([0,1.1,-5,5])
f_ax10.axis([0,1.1,-5,5])
f_ax11.axis([0,1.1,-5,5])

# the wing is in the 0th loop for the 6 9 10

f_plot_cp_profile_1(f_ax,get_case_root(case_name,num_procs),f_nx_1,f_ny_1,f_nz_1,f_x_loc_1,f_y_loc_1,f_z_loc_1) #ok


f_plot_cp_profile_2(f_ax2,get_case_root(case_name,num_procs),f_nx_2,f_ny_2,f_nz_2,f_x_loc_2,f_y_loc_2,f_z_loc_2) # ok
f_plot_cp_profile_4(f_ax4,get_case_root(case_name,num_procs),f_nx_4,f_ny_4,f_nz_4,f_x_loc_4,f_y_loc_4,f_z_loc_4) # ok
f_plot_cp_profile_5(f_ax5,get_case_root(case_name,num_procs),f_nx_5,f_ny_5,f_nz_5,f_x_loc_5,f_y_loc_5,f_z_loc_5) # ok
f_plot_cp_profile_6(f_ax6,get_case_root(case_name,num_procs),f_nx_6,f_ny_6,f_nz_6,f_x_loc_6,f_y_loc_6,f_z_loc_6) # ok
f_plot_cp_profile_7(f_ax7,get_case_root(case_name,num_procs),f_nx_7,f_ny_7,f_nz_7,f_x_loc_7,f_y_loc_7,f_z_loc_7) # ok
f_plot_cp_profile_8(f_ax8,get_case_root(case_name,num_procs),f_nx_8,f_ny_8,f_nz_8,f_x_loc_8,f_y_loc_8,f_z_loc_8) # ok
f_plot_cp_profile_9(f_ax9,get_case_root(case_name,num_procs),f_nx_9,f_ny_9,f_nz_9,f_x_loc_9,f_y_loc_9,f_z_loc_9) # ok
f_plot_cp_profile_10(f_ax10,get_case_root(case_name,num_procs),f_nx_10,f_ny_10,f_nz_10,f_x_loc_10,f_y_loc_10,f_z_loc_10) # ok
f_plot_cp_profile_11(f_ax11,get_case_root(case_name,num_procs),f_nx_11,f_ny_11,f_nz_11,f_x_loc_11,f_y_loc_11,f_z_loc_11) # not
f_ax.plot(f_loop_data_1[0][0],f_loop_data_1[0][1], color='r', markersize=20)
f_ax2.plot(f_loop_data_2[0][0],f_loop_data_2[0][1], color='r', markersize=20)
f_ax4.plot(f_loop_data_4[0][0],f_loop_data_4[0][1], color='r', markersize=20)
f_ax5.plot(f_loop_data_5[0][0],f_loop_data_5[0][1], color='r', markersize=20)
f_ax6.plot(f_loop_data_6[0][0],f_loop_data_6[0][1], color='r', markersize=20)
f_ax7.plot(f_loop_data_7[0][0],f_loop_data_7[0][1], color='r', markersize=20)
f_ax8.plot(f_loop_data_8[0][0],f_loop_data_8[0][1], color='r', markersize=20)
f_ax9.plot(f_loop_data_9[0][0],f_loop_data_9[0][1], color='r', markersize=20)
f_ax10.plot(f_loop_data_10[0][0],f_loop_data_10[0][1], color='r', markersize=20)
f_ax11.plot(f_loop_data_11[0][0],f_loop_data_11[0][1], color='r', markersize=20)

# SELECT THE LOOPS OF INTEREST AND NORMALIZE THEM
# select the rigth loop for the flap

#ps1
f_min_loop_1 = min(f_loop_data_1[0][0]); f_max_loop_1 = max(f_loop_data_1[0][0]);
f_norm_loop_1 = np.zeros(len(f_loop_data_1[0][0])) ;
f_d1 = f_max_loop_1-f_min_loop_1 ;
for i in range (0,len(f_loop_data_1[0][0])):
    f_norm_loop_1[i] = (f_loop_data_1[0][0][i]-f_min_loop_1)/f_d1
#ps2
f_min_loop_2 = min(f_loop_data_2[0][0]); f_max_loop_2 = max(f_loop_data_2[0][0]);
f_norm_loop_2 = np.zeros(len(f_loop_data_2[0][0])) ;
f_d2 = f_max_loop_2-f_min_loop_2 ;
for i in range (0,len(f_loop_data_2[0][0])):
    f_norm_loop_2[i] = (f_loop_data_2[0][0][i]-f_min_loop_2)/f_d2
#ps4
f_min_loop_4 = min(f_loop_data_4[0][0]); f_max_loop_4 = max(f_loop_data_4[0][0]);
f_norm_loop_4 = np.zeros(len(f_loop_data_4[0][0])) ;
f_d4 = f_max_loop_4-f_min_loop_4 ;
for i in range (0,len(f_loop_data_4[0][0])):
    f_norm_loop_4[i] = (f_loop_data_4[0][0][i]-f_min_loop_4)/f_d4
#ps5
f_min_loop_5 = min(f_loop_data_5[0][0]); f_max_loop_5 = max(f_loop_data_5[0][0]);
f_norm_loop_5 = np.zeros(len(f_loop_data_5[0][0])) ;
f_d5 = f_max_loop_5-f_min_loop_5 ;
for i in range (0,len(f_loop_data_5[0][0])):
    f_norm_loop_5[i] = (f_loop_data_5[0][0][i]-f_min_loop_5)/f_d5
#ps6
f_min_loop_6 = min(f_loop_data_6[0][0]); f_max_loop_6 = max(f_loop_data_6[0][0]);
f_norm_loop_6 = np.zeros(len(f_loop_data_6[0][0])) ;
f_d6 = f_max_loop_6-f_min_loop_6 ;
for i in range (0,len(f_loop_data_6[0][0])):
    f_norm_loop_6[i] = (f_loop_data_6[0][0][i]-f_min_loop_6)/f_d6
#ps7
f_min_loop_7 = min(f_loop_data_7[0][0]); f_max_loop_7 = max(f_loop_data_7[0][0]);
f_norm_loop_7 = np.zeros(len(f_loop_data_7[0][0])) ;
f_d7 = f_max_loop_7-f_min_loop_7 ;
for i in range (0,len(f_loop_data_7[0][0])):
    f_norm_loop_7[i] = (f_loop_data_7[0][0][i]-f_min_loop_7)/f_d7
#ps8
f_min_loop_8 = min(f_loop_data_8[0][0]); f_max_loop_8 = max(f_loop_data_8[0][0]);
f_norm_loop_8 = np.zeros(len(f_loop_data_8[0][0])) ;
f_d8 = f_max_loop_8-f_min_loop_8 ;
for i in range (0,len(f_loop_data_8[0][0])):
    f_norm_loop_8[i] = (f_loop_data_8[0][0][i]-f_min_loop_8)/f_d8
#ps9
f_min_loop_9 = min(f_loop_data_9[0][0]); f_max_loop_9 = max(f_loop_data_9[0][0]);
f_norm_loop_9 = np.zeros(len(f_loop_data_9[0][0])) ;
f_d9 = f_max_loop_1-f_min_loop_9 ;
for i in range (0,len(f_loop_data_9[0][0])):
    f_norm_loop_9[i] = (f_loop_data_9[0][0][i]-f_min_loop_9)/f_d9

#ps10
f_min_loop_10 = min(f_loop_data_10[0][0]); f_max_loop_10 = max(f_loop_data_10[0][0]);
f_norm_loop_10 = np.zeros(len(f_loop_data_10[0][0])) ;
f_d10 = f_max_loop_10-f_min_loop_10 ;
for i in range (0,len(f_loop_data_10[0][0])):
    f_norm_loop_10[i] = (f_loop_data_10[0][0][i]-f_min_loop_10)/f_d10
#ps11
f_min_loop_11 = min(f_loop_data_11[0][0]); f_max_loop_11 = max(f_loop_data_11[0][0]);
f_norm_loop_11 = np.zeros(len(f_loop_data_11[0][0])) ;
f_d11 = f_max_loop_11-f_min_loop_11 ;
for i in range (0,len(f_loop_data_11[0][0])):
    f_norm_loop_11[i] = (f_loop_data_11[0][0][i]-f_min_loop_11)/f_d11


## COMPARE THE DATA WITH THE EXPERIMENTAL RESULTS
In [13]:
from matplotlib.backends.backend_pdf import PdfPages
from IPython.display import FileLink, display

from collections import OrderedDict
import matplotlib.font_manager as fm
prop=fm.FontProperties(size=20)

## VALIDATION OF THE WING
## we need to plot the whole section from 0 to 1 and not separately from 0 to 1.....Applied only to experimental
## we need to define eta = x_local / semispan

#eta = ['0.15' , '0.288' , '0.449' , '0.543' , '0.681' , '0.715' ,'0.818' , '0.891' ,'0.964']

comp_fig1 = pl.figure(figsize=(40, 10),dpi=150, facecolor='w', edgecolor='k')
comp_fig1.suptitle('PS1', fontsize=30, fontweight='bold')

comp_ax =comp_fig1.add_subplot(1,3,1)
comp_ax_w =comp_fig1.add_subplot(1,3,2)
comp_ax_f =comp_fig1.add_subplot(1,3,3)

comp_ax.grid(True)
comp_ax.set_xlabel('x/c', fontsize=20, fontweight='bold')
comp_ax.set_ylabel('Cp []', fontsize=20, fontweight='bold')
comp_ax.set_title('Slat', fontsize=20, fontweight='bold')
comp_ax.axis([-0.001,1.01,1.5,-4.])

comp_ax_w.grid(True)
comp_ax_w.set_xlabel('x/c', fontsize=20, fontweight='bold')
comp_ax_w.set_ylabel('Cp []', fontsize=20, fontweight='bold')
comp_ax_w.set_title('Main Wing', fontsize=20, fontweight='bold')
comp_ax_w.axis([-0.001,1.01,1.5,-4.])

comp_ax_f.grid(True)
comp_ax_f.set_xlabel('x/c', fontsize=20, fontweight='bold')
comp_ax_f.set_ylabel('Cp []', fontsize=20, fontweight='bold')
comp_ax_f.set_title('Flap', fontsize=20, fontweight='bold')
comp_ax_f.axis([-0.001,1.01,1.5,-4.])

comp_ax.plot(cp_ps01_slat[0],cp_ps01_slat[6],'b.', color='b', markersize=25,label = 'Experiment')
comp_ax.plot(s_norm_loop_1,s_loop_data_1[2][1],'b.', color='r',markersize=20,label = 'zCFD')
comp_ax_w.plot(cp_ps01[0],cp_ps01[6],'b.', color='b', markersize=25, label = 'Experiment')
comp_ax_w.plot(w_norm_loop_1,w_loop_data_1[1][1] ,'b.',color='r',markersize=20,label = 'zCFD')
comp_ax_f.plot(cp_ps01_flap[0],cp_ps01_flap[6],'b.', color='b', markersize=25,label = 'Experiment')
comp_ax_f.plot(f_norm_loop_1,f_loop_data_1[0][1], 'b.', color ='r', markersize=20,label = 'zCFD')

comp_ax.legend(loc = 'upper right',numpoints=1,prop = prop)
comp_ax_w.legend(loc = 'upper right',numpoints=1,prop = prop)
comp_ax_f.legend(loc = 'upper right',numpoints=1,prop = prop)

pp1 = PdfPages('11.pdf')
pp1.savefig()
pp1.close()
comp_fig1.savefig("11.png")
show()
display(FileLink('11.png'))
# station 2

comp_fig2 = pl.figure(figsize=(40, 10),dpi=600, facecolor='w', edgecolor='k')
comp_fig2.suptitle('PS2', fontsize=30, fontweight='bold')

comp_ax_2 =comp_fig2.add_subplot(1,3,1)
comp_ax_w_2 =comp_fig2.add_subplot(1,3,2)
comp_ax_f_2 =comp_fig2.add_subplot(1,3,3)

comp_ax_2.grid(True)
comp_ax_2.set_xlabel('x/c', fontsize=20, fontweight='bold')
comp_ax_2.set_ylabel('Cp []', fontsize=20, fontweight='bold')
comp_ax_2.set_title('Slat', fontsize=20, fontweight='bold')
comp_ax_2.axis([-0.001,1.01,1.5,-4.])

comp_ax_w_2.grid(True)
comp_ax_w_2.set_xlabel('x/c', fontsize=20, fontweight='bold')
comp_ax_w_2.set_ylabel('Cp []', fontsize=20, fontweight='bold')
comp_ax_w_2.set_title('Main Wing', fontsize=20, fontweight='bold')
comp_ax_w_2.axis([-0.001,1.01,1.5,-4.])

comp_ax_f_2.grid(True)
comp_ax_f_2.set_xlabel('x/c', fontsize=20, fontweight='bold')
comp_ax_f_2.set_ylabel('Cp []', fontsize=20, fontweight='bold')
comp_ax_f_2.set_title('Flap', fontsize=20, fontweight='bold')
comp_ax_f_2.axis([-0.001,1.01,1.5,-4.])

comp_ax_2.plot(cp_ps02_slat[0],cp_ps02_slat[6],'b.', color='b', markersize=25,label = 'Experiment')
comp_ax_2.plot(s_norm_loop_2,s_loop_data_2[2][1],'b.', color='r',markersize=20,label = 'zCFD')
comp_ax_w_2.plot(cp_ps02[0],cp_ps02[6],'b.', color='b', markersize=25,label = 'Experiment')
comp_ax_w_2.plot(w_norm_loop_2,w_loop_data_2[1][1] ,'b.',color='r',markersize=20, label = 'zCFD')
comp_ax_f_2.plot(cp_ps02_flap[0],cp_ps02_flap[6],'b.', color='b', markersize=25, label = 'Experiment')
comp_ax_f_2.plot(f_norm_loop_2,f_loop_data_2[0][1], 'b.', color ='r', markersize=20, label = 'zCFD')

comp_ax_2.legend(loc = 'upper right',numpoints=1,prop = prop)
comp_ax_w_2.legend(loc = 'upper right',numpoints=1,prop = prop)
comp_ax_f_2.legend(loc = 'upper right',numpoints=1,prop = prop)

pp2 = PdfPages('22.pdf')
pp2.savefig()
pp2.close()
comp_fig2.savefig("22.png")
show()
display(FileLink('22.png'))

# station 4

comp_fig4 = pl.figure(figsize=(40, 10),dpi=600, facecolor='w', edgecolor='k')
comp_fig4.suptitle('PS4', fontsize=30, fontweight='bold')

comp_ax_4 =comp_fig4.add_subplot(1,3,1)
comp_ax_w_4 =comp_fig4.add_subplot(1,3,2)
comp_ax_f_4 =comp_fig4.add_subplot(1,3,3)

comp_ax_4.grid(True)
comp_ax_4.set_xlabel('x/c', fontsize=20, fontweight='bold')
comp_ax_4.set_ylabel('Cp []', fontsize=20, fontweight='bold')
comp_ax_4.set_title('Slat', fontsize=20, fontweight='bold')
comp_ax_4.axis([-0.001,1.01,1.5,-4.])

comp_ax_w_4.grid(True)
comp_ax_w_4.set_xlabel('x/c', fontsize=20, fontweight='bold')
comp_ax_w_4.set_ylabel('Cp []', fontsize=20, fontweight='bold')
comp_ax_w_4.set_title('Main Wing', fontsize=20, fontweight='bold')
comp_ax_w_4.axis([-0.001,1.01,1.5,-4.])

comp_ax_f_4.grid(True)
comp_ax_f_4.set_xlabel('x/c', fontsize=20, fontweight='bold')
comp_ax_f_4.set_ylabel('Cp []', fontsize=20, fontweight='bold')
comp_ax_f_4.set_title('Flap', fontsize=20, fontweight='bold')
comp_ax_f_4.axis([-0.001,1.01,1.5,-4.])

comp_ax_4.plot(cp_ps04_slat[0],cp_ps04_slat[6],'b.', color='b', markersize=25, label = 'Experiment')
comp_ax_4.plot(s_norm_loop_4,s_loop_data_4[2][1],'b.', color='r',markersize=20 , label = 'zCFD')
comp_ax_w_4.plot(cp_ps04[0],cp_ps04[6],'b.', color='b', markersize=25 , label = 'Experiment')
comp_ax_w_4.plot(w_norm_loop_4,w_loop_data_4[1][1] ,'b.',color='r',markersize=20, label = 'zCFD')
comp_ax_f_4.plot(cp_ps04_flap[0],cp_ps04_flap[6],'b.', color='b', markersize=25 ,label = 'Experiment')
comp_ax_f_4.plot(f_norm_loop_4,f_loop_data_4[0][1], 'b.', color ='r', markersize=20 ,label = 'zCFD')

comp_ax_4.legend(loc = 'upper right',numpoints=1,prop = prop)
comp_ax_w_4.legend(loc = 'upper right',numpoints=1,prop = prop)
comp_ax_f_4.legend(loc = 'upper right',numpoints=1,prop = prop)

pp4 = PdfPages('44.pdf')
pp4.savefig()
pp4.close()
comp_fig4.savefig("44.png")
show()
display(FileLink('44.png'))

# station 5

comp_fig5 = pl.figure(figsize=(40, 10),dpi=600, facecolor='w', edgecolor='k')
comp_fig5.suptitle('PS5', fontsize=30, fontweight='bold')

comp_ax_5 =comp_fig5.add_subplot(1,3,1)
comp_ax_w_5 =comp_fig5.add_subplot(1,3,2)
comp_ax_f_5 =comp_fig5.add_subplot(1,3,3)

comp_ax_5.grid(True)
comp_ax_5.set_xlabel('x/c', fontsize=20, fontweight='bold')
comp_ax_5.set_ylabel('Cp []', fontsize=20, fontweight='bold')
comp_ax_5.set_title('Slat', fontsize=20, fontweight='bold')
comp_ax_5.axis([-0.001,1.01,1.5,-4.])

comp_ax_w_5.grid(True)
comp_ax_w_5.set_xlabel('x/c', fontsize=20, fontweight='bold')
comp_ax_w_5.set_ylabel('Cp []', fontsize=20, fontweight='bold')
comp_ax_w_5.set_title('Main Wing', fontsize=20, fontweight='bold')
comp_ax_w_5.axis([-0.001,1.01,1.5,-4.])

comp_ax_f_5.grid(True)
comp_ax_f_5.set_xlabel('x/c', fontsize=20, fontweight='bold')
comp_ax_f_5.set_ylabel('Cp []', fontsize=20, fontweight='bold')
comp_ax_f_5.set_title('Flap', fontsize=20, fontweight='bold')
comp_ax_f_5.axis([-0.001,1.01,1.5,-4.])

comp_ax_5.plot(cp_ps05_slat[0],cp_ps05_slat[6],'b.', color='b', markersize=25, label = 'Experiment')
comp_ax_5.plot(s_norm_loop_5,s_loop_data_5[2][1],'b.', color='r',markersize=20, label = 'zCFD') # the slat is not in the first loop
comp_ax_w_5.plot(cp_ps05[0],cp_ps05[6],'b.', color='b', markersize=25, label = 'Experiment')
comp_ax_w_5.plot(w_norm_loop_5,w_loop_data_5[1][1] ,'b.',color='r',markersize=20, label = 'zCFD')
comp_ax_f_5.plot(cp_ps05_flap[0],cp_ps05_flap[6],'b.', color='b', markersize=25 , label = 'Experiment')
comp_ax_f_5.plot(f_norm_loop_5,f_loop_data_5[0][1], 'b.', color ='r', markersize=20, label = 'zCFD')

comp_ax_5.legend(loc = 'upper right',numpoints=1,prop = prop)
comp_ax_w_5.legend(loc = 'upper right',numpoints=1,prop = prop)
comp_ax_f_5.legend(loc = 'upper right',numpoints=1,prop = prop)

pp5 = PdfPages('55.pdf')
pp5.savefig()
pp5.close()
comp_fig5.savefig("55.png")
show()
display(FileLink('55.png'))
# station 6

comp_fig6 = pl.figure(figsize=(40, 10),dpi=600, facecolor='w', edgecolor='k')
comp_fig6.suptitle('PS6', fontsize=30, fontweight='bold')

comp_ax_6 =comp_fig6.add_subplot(1,3,1)
comp_ax_w_6 =comp_fig6.add_subplot(1,3,2)
comp_ax_f_6 =comp_fig6.add_subplot(1,3,3)

comp_ax_6.grid(True)
comp_ax_6.set_xlabel('x/c', fontsize=20, fontweight='bold')
comp_ax_6.set_ylabel('Cp []', fontsize=20, fontweight='bold')
comp_ax_6.set_title('Slat', fontsize=20, fontweight='bold')
comp_ax_6.axis([-0.001,1.01,1.5,-4.])

comp_ax_w_6.grid(True)
comp_ax_w_6.set_xlabel('x/c', fontsize=20, fontweight='bold')
comp_ax_w_6.set_ylabel('Cp []', fontsize=20, fontweight='bold')
comp_ax_w_6.set_title('Main Wing', fontsize=20, fontweight='bold')
comp_ax_w_6.axis([-0.001,1.01,1.5,-4.])

comp_ax_f_6.grid(True)
comp_ax_f_6.set_xlabel('x/c', fontsize=20, fontweight='bold')
comp_ax_f_6.set_ylabel('Cp []', fontsize=20, fontweight='bold')
comp_ax_f_6.set_title('Flap', fontsize=20, fontweight='bold')
comp_ax_f_6.axis([-0.001,1.01,1.5,-4.])

comp_ax_6.plot(cp_ps06_slat[0],cp_ps06_slat[6],'b.', color='b', markersize=25,label = 'Experiment')
comp_ax_6.plot(s_norm_loop_6,s_loop_data_6[2][1],'b.', color='r',markersize=20, label = 'zCFD')
comp_ax_w_6.plot(cp_ps06[0],cp_ps06[6],'b.', color='b', markersize=25, label = 'Experiment')
comp_ax_w_6.plot(w_norm_loop_6,w_loop_data_6[1][1] ,'b.',color='r',markersize=20, label = 'zCFD')
comp_ax_f_6.plot(cp_ps06_flap[0],cp_ps06_flap[6],'b.', color='b', markersize=25, label = 'Experiment')
comp_ax_f_6.plot(f_norm_loop_6,f_loop_data_6[0][1], 'b.', color ='r', markersize=20, label = 'zCFD')

comp_ax_6.legend(loc = 'upper right',numpoints=1,prop = prop)
comp_ax_w_6.legend(loc = 'upper right',numpoints=1,prop = prop)
comp_ax_f_6.legend(loc = 'upper right',numpoints=1,prop = prop)

pp6 = PdfPages('66.pdf')
pp6.savefig()
pp6.close()
comp_fig6.savefig("66.png")
show()
display(FileLink('66.png'))

# station 7

comp_fig7 = pl.figure(figsize=(40, 10),dpi=600, facecolor='w', edgecolor='k')
comp_fig7.suptitle('PS7', fontsize=30, fontweight='bold')

comp_ax_7 =comp_fig7.add_subplot(1,3,1)
comp_ax_w_7 =comp_fig7.add_subplot(1,3,2)
comp_ax_f_7 =comp_fig7.add_subplot(1,3,3)

comp_ax_7.grid(True)
comp_ax_7.set_xlabel('x/c', fontsize=20, fontweight='bold')
comp_ax_7.set_ylabel('Cp []', fontsize=20, fontweight='bold')
comp_ax_7.set_title('Slat', fontsize=20, fontweight='bold')
comp_ax_7.axis([-0.001,1.01,1.5,-4.])

comp_ax_w_7.grid(True)
comp_ax_w_7.set_xlabel('x/c', fontsize=20, fontweight='bold')
comp_ax_w_7.set_ylabel('Cp []', fontsize=20, fontweight='bold')
comp_ax_w_7.set_title('Main Wing', fontsize=20, fontweight='bold')
comp_ax_w_7.axis([-0.001,1.01,1.5,-4.])

comp_ax_f_7.grid(True)
comp_ax_f_7.set_xlabel('x/c', fontsize=20, fontweight='bold')
comp_ax_f_7.set_ylabel('Cp []', fontsize=20, fontweight='bold')
comp_ax_f_7.set_title('Flap', fontsize=20, fontweight='bold')
comp_ax_f_7.axis([-0.001,1.01,1.5,-4.])

comp_ax_7.plot(cp_ps06_slat[0],cp_ps06_slat[6],'b.', color='b', markersize=25, label = 'Experiment')
comp_ax_7.plot(s_norm_loop_7,s_loop_data_7[2][1],'b.', color='r',markersize=20, label = 'zCFD') #
comp_ax_w_7.plot(cp_ps07[0],cp_ps07[6],'b.', color='b', markersize=25 ,label = 'Experiment')
comp_ax_w_7.plot(w_norm_loop_7,w_loop_data_7[1][1] ,'b.',color='r',markersize=20, label = 'zCFD')
comp_ax_f_7.plot(cp_ps07_flap[0],cp_ps07_flap[6],'b.', color='b', markersize=25, label = 'Experiment')
comp_ax_f_7.plot(f_norm_loop_7,f_loop_data_7[0][1], 'b.', color ='r', markersize=20, label = 'zCFD')

comp_ax_7.legend(loc = 'upper right',numpoints=1,prop = prop)
comp_ax_w_7.legend(loc = 'upper right',numpoints=1,prop = prop)
comp_ax_f_7.legend(loc = 'upper right',numpoints=1,prop = prop)

pp7 = PdfPages('77.pdf')
pp7.savefig()
pp7.close()
comp_fig7.savefig("77.png")
show()
display(FileLink('77.png'))

# station 8

comp_fig8 = pl.figure(figsize=(40, 10),dpi=600, facecolor='w', edgecolor='k')
comp_fig8.suptitle('PS8', fontsize=30, fontweight='bold')

comp_ax_8 =comp_fig8.add_subplot(1,3,1)
comp_ax_w_8 =comp_fig8.add_subplot(1,3,2)
comp_ax_f_8 =comp_fig8.add_subplot(1,3,3)

comp_ax_8.grid(True)
comp_ax_8.set_xlabel('x/c', fontsize=20, fontweight='bold')
comp_ax_8.set_ylabel('Cp []', fontsize=20, fontweight='bold')
comp_ax_8.set_title('Slat', fontsize=20, fontweight='bold')
comp_ax_8.axis([-0.001,1.01,1.5,-4.])

comp_ax_w_8.grid(True)
comp_ax_w_8.set_xlabel('x/c', fontsize=20, fontweight='bold')
comp_ax_w_8.set_ylabel('Cp []', fontsize=20, fontweight='bold')
comp_ax_w_8.set_title('Main Wing', fontsize=20, fontweight='bold')
comp_ax_w_8.axis([-0.001,1.01,1.5,-4.])

comp_ax_f_8.grid(True)
comp_ax_f_8.set_xlabel('x/c', fontsize=20, fontweight='bold')
comp_ax_f_8.set_ylabel('Cp []', fontsize=20, fontweight='bold')
comp_ax_f_8.set_title('Flap', fontsize=20, fontweight='bold')
comp_ax_f_8.axis([-0.001,1.01,1.5,-4.])

comp_ax_8.plot(cp_ps08_slat[0],cp_ps08_slat[6],'b.', color='b', markersize=25, label = 'Experiment')
comp_ax_8.plot(s_norm_loop_8,s_loop_data_8[2][1],'b.', color='r',markersize=20, label = 'zCFD') #
comp_ax_w_8.plot(cp_ps08[0],cp_ps08[6],'b.', color='b', markersize=25 ,label = 'Experiment')
comp_ax_w_8.plot(w_norm_loop_8,w_loop_data_8[1][1] ,'b.',color='r',markersize=20, label = 'zCFD')
comp_ax_f_8.plot(cp_ps08_flap[0],cp_ps08_flap[6],'b.', color='b', markersize=25, label = 'Experiment')
comp_ax_f_8.plot(f_norm_loop_8,f_loop_data_8[0][1], 'b.', color ='r', markersize=20, label = 'zCFD')

comp_ax_8.legend(loc = 'upper right',numpoints=1,prop = prop)
comp_ax_w_8.legend(loc = 'upper right',numpoints=1,prop = prop)
comp_ax_f_8.legend(loc = 'upper right',numpoints=1,prop = prop)

pp8 = PdfPages('88.pdf')
pp8.savefig()
pp8.close()
comp_fig8.savefig("88.png")
show()
display(FileLink('88.png'))
# station 9

comp_fig9 = pl.figure(figsize=(40, 10),dpi=600, facecolor='w', edgecolor='k')
comp_fig9.suptitle('PS9', fontsize=30, fontweight='bold')

comp_ax_9 =comp_fig9.add_subplot(1,3,1)
comp_ax_w_9 =comp_fig9.add_subplot(1,3,2)
comp_ax_f_9 =comp_fig9.add_subplot(1,3,3)

comp_ax_9.grid(True)
comp_ax_9.set_xlabel('x/c', fontsize=20, fontweight='bold')
comp_ax_9.set_ylabel('Cp []', fontsize=20, fontweight='bold')
comp_ax_9.set_title('Slat', fontsize=20, fontweight='bold')
comp_ax_9.axis([-0.001,1.01,1.5,-4.])

comp_ax_w_9.grid(True)
comp_ax_w_9.set_xlabel('x/c', fontsize=20, fontweight='bold')
comp_ax_w_9.set_ylabel('Cp []', fontsize=20, fontweight='bold')
comp_ax_w_9.set_title('Main Wing', fontsize=20, fontweight='bold')
comp_ax_w_9.axis([-0.001,1.01,1.5,-4.])

comp_ax_f_9.grid(True)
comp_ax_f_9.set_xlabel('x/c', fontsize=20, fontweight='bold')
comp_ax_f_9.set_ylabel('Cp []', fontsize=20, fontweight='bold')
comp_ax_f_9.set_title('Flap', fontsize=20, fontweight='bold')
comp_ax_f_9.axis([-0.001,1.01,1.5,-4.])

comp_ax_9.plot(cp_ps09_slat[0],cp_ps09_slat[6],'b.', color='b', markersize=25, label = 'Experiment')
comp_ax_9.plot(s_norm_loop_9,s_loop_data_9[2][1],'b.', color='r',markersize=20, label = 'zCFD') #
comp_ax_w_9.plot(cp_ps09[0],cp_ps09[6],'b.', color='b', markersize=25, label = 'Experimet')
comp_ax_w_9.plot(w_norm_loop_9,w_loop_data_9[1][1] ,'b.',color='r',markersize=20 , label = 'zCFD')
comp_ax_f_9.plot(cp_ps09_flap[0],cp_ps09_flap[6],'b.', color='b', markersize=25, label = 'Experiment')
comp_ax_f_9.plot(f_norm_loop_9,f_loop_data_9[0][1], 'b.', color ='r', markersize=20, label = 'zCFD')

comp_ax_9.legend(loc = 'upper right',numpoints=1,prop = prop)
comp_ax_w_9.legend(loc = 'upper right',numpoints=1,prop = prop)
comp_ax_f_9.legend(loc = 'upper right',numpoints=1,prop = prop)

pp9 = PdfPages('99.pdf')
pp9.savefig()
pp9.close()
comp_fig9.savefig("99.png")
show()
display(FileLink('99.png'))

# station 10

comp_fig10 = pl.figure(figsize=(40, 10),dpi=600, facecolor='w', edgecolor='k')
comp_fig10.suptitle('PS10', fontsize=30, fontweight='bold')

comp_ax_10 =comp_fig10.add_subplot(1,3,1)
comp_ax_w_10 =comp_fig10.add_subplot(1,3,2)
comp_ax_f_10 =comp_fig10.add_subplot(1,3,3)

comp_ax_10.grid(True)
comp_ax_10.set_xlabel('x/c', fontsize=20, fontweight='bold')
comp_ax_10.set_ylabel('Cp []', fontsize=20, fontweight='bold')
comp_ax_10.set_title('Slat', fontsize=20, fontweight='bold')
comp_ax_10.axis([-0.001,1.01,1.5,-4.])

comp_ax_w_10.grid(True)
comp_ax_w_10.set_xlabel('x/c', fontsize=20, fontweight='bold')
comp_ax_w_10.set_ylabel('Cp []', fontsize=20, fontweight='bold')
comp_ax_w_10.set_title('Main Wing', fontsize=20, fontweight='bold')
comp_ax_w_10.axis([-0.001,1.01,1.5,-4.])

comp_ax_f_10.grid(True)
comp_ax_f_10.set_xlabel('x/c', fontsize=20, fontweight='bold')
comp_ax_f_10.set_ylabel('Cp []', fontsize=20, fontweight='bold')
comp_ax_f_10.set_title('Flap', fontsize=20, fontweight='bold')
comp_ax_f_10.axis([-0.001,1.01,1.5,-4.])

comp_ax_10.plot(cp_ps10_slat[0],cp_ps10_slat[6],'b.', color='b', markersize=25, label = 'Experiment')
comp_ax_10.plot(s_norm_loop_10,s_loop_data_10[2][1],'b.', color='r',markersize=20, label = 'zCFD') #
comp_ax_w_10.plot(cp_ps10[0],cp_ps10[6],'b.', color='b', markersize=25, label = 'Experiment')
comp_ax_w_10.plot(w_norm_loop_10,w_loop_data_10[1][1] ,'b.',color='r',markersize=20, label = 'zCFD')
comp_ax_f_10.plot(cp_ps10_flap[0],cp_ps10_flap[6],'b.', color='b', markersize=25, label = 'Experiment')
comp_ax_f_10.plot(f_norm_loop_10,f_loop_data_10[0][1], 'b.', color ='r', markersize=20, label = 'zCFD')

comp_ax_10.legend(loc = 'upper right',numpoints=1,prop = prop)
comp_ax_w_10.legend(loc = 'upper right',numpoints=1,prop = prop)
comp_ax_f_10.legend(loc = 'upper right',numpoints=1,prop = prop)

pp10 = PdfPages('10.pdf')
pp10.savefig()
pp10.close()
comp_fig10.savefig("10.png")
show()
display(FileLink('10.png'))
# station 11

comp_fig11 = pl.figure(figsize=(40, 10),dpi=600, facecolor='w', edgecolor='k')
comp_fig11.suptitle('PS11', fontsize=30, fontweight='bold')

comp_ax_11 =comp_fig11.add_subplot(1,3,1)
comp_ax_w_11 =comp_fig11.add_subplot(1,3,2)
comp_ax_f_11 =comp_fig11.add_subplot(1,3,3)

comp_ax_11.grid(True)
comp_ax_11.set_xlabel('x/c', fontsize=20, fontweight='bold')
comp_ax_11.set_ylabel('Cp []', fontsize=20, fontweight='bold')
comp_ax_11.set_title('Slat', fontsize=20, fontweight='bold')
comp_ax_11.axis([-0.001,1.01,1.5,-4.])

comp_ax_w_11.grid(True)
comp_ax_w_11.set_xlabel('x/c', fontsize=20, fontweight='bold')
comp_ax_w_11.set_ylabel('Cp []', fontsize=20, fontweight='bold')
comp_ax_w_11.set_title('Main Wing', fontsize=20, fontweight='bold')
comp_ax_w_11.axis([-0.001,1.01,1.5,-4.])

comp_ax_f_11.grid(True)
comp_ax_f_11.set_xlabel('x/c', fontsize=20, fontweight='bold')
comp_ax_f_11.set_ylabel('Cp []', fontsize=20, fontweight='bold')
comp_ax_f_11.set_title('Flap', fontsize=20, fontweight='bold')
comp_ax_f_11.axis([-0.001,1.01,1.5,-4.])

comp_ax_11.plot(cp_ps11_slat[0],cp_ps11_slat[6],'b.', color='b', markersize=25, label = 'Experiment')
comp_ax_11.plot(s_norm_loop_11,s_loop_data_11[2][1],'b.', color='r',markersize=20, label = 'zCFD') #
comp_ax_w_11.plot(cp_ps11[0],cp_ps11[6],'b.', color='b', markersize=25, label = 'Experiment')
comp_ax_w_11.plot(w_norm_loop_11,w_loop_data_11[1][1] ,'b.',color='r',markersize=20, label = 'zCFD')
comp_ax_f_11.plot(cp_ps11_flap[0],cp_ps11_flap[6],'b.', color='b', markersize=25, label = 'Experiment')
comp_ax_f_11.plot(f_norm_loop_11,f_loop_data_11[0][1], 'b.', color ='r', markersize=20, label = 'zCFD')


comp_ax_11.legend(loc = 'upper right',numpoints=1,prop = prop)
comp_ax_w_11.legend(loc = 'upper right',numpoints=1,prop = prop)
comp_ax_f_11.legend(loc = 'upper right',numpoints=1,prop = prop)

pp11 = PdfPages('1_11.pdf')
pp11.savefig()
pp11.close()
comp_fig11.savefig("1_11.png")
show()
display(FileLink('1_11.png'))


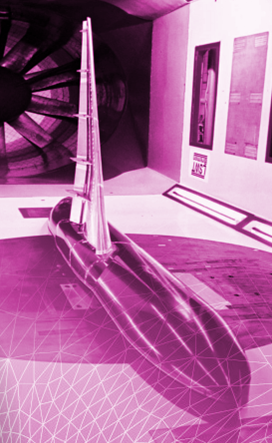
Convergence
In [21]:
from zutil.post import residual_plot, get_case_report
residual_plot(get_case_report(case_name))
show()

Cleaning up
In [15]:
if remote_data:
    print 'Disconnecting from remote paraview server connection'
    Disconnect()
    pass
Disconnecting from remote paraview server connection
In [15]: