What is IPython?
- Powerful interactive shells (terminal and Qt).
- A browser-based notebook with support for code, text, mathematical expressions, inline plots and other rich media.
- Support for interactive data visualization and use of GUI toolkits.
- Flexible, embeddable interpreters to load into your own projects.
- Easy to use, high performance tools for parallel computing.
What is IPython also?


- Full list here: https://github.com/ipython/ipython/wiki/Projects-using-IPython
- Build your own: http://andrew.gibiansky.com/blog/ipython/ipython-kernels/
Who develops IPython?
- Team 1: Berkeley under Fernando Perez
- Team 2: Cal Poly, San Luis Obispo under Brian Granger
- Team 3: The internet
Who funds IPython development?
In December 2012, IPython was awarded a $1.15 million grant from the Alfred P. Sloan Foundation that will fund the core team for the 2013-2014 period.
In the summer of 2013, Microsoft made a $100,000 donation to support all aspects of the IPython project.
Learning Resources

Getting It
sudo apt-get install ipython-notebook
pip install --user ipython-notebook
Or, if you feel enthusiastic:
sudo apt-get install "python-(numpy|scipy|matplotlib|skimage|sklearn|pandas|sympy)$" ipython
Command prompt demo
The IPython Notebook
IPython Notebook Demo
- File format
- Modal navigation
- Inline plotting
- LaTeX
- Widgets
- export (e.g. slides)
Audio & Video
%matplotlib inline

import numpy as np
import matplotlib.pyplot as plt

f = 300
T = 2
rate = 8192

t = np.linspace(0, T, T * rate)
s = np.sin(t * 2 * np.pi * f)

plt.plot(t[:100], s[:100]);

from IPython.display import Audio
Audio(data=s, rate=8192)
from IPython.display import YouTubeVideo

YouTubeVideo('dhRUe-gz690')
Other rich objects
x = np.linspace(0, 1, 100)
y = x[:, np.newaxis]

plt.imshow(np.sin(x**3 + np.sqrt(y)), interpolation='nearest', cmap='jet')

# (By the way, never use the jet colormap);

%%file data.csv
Date,Open,High,Low,Close,Volume,Adj Close
2012-06-01,569.16,590.00,548.50,584.00,14077000,581.50
2012-05-01,584.90,596.76,522.18,577.73,18827900,575.26
2012-04-02,601.83,644.00,555.00,583.98,28759100,581.48
2012-03-01,548.17,621.45,516.22,599.55,26486000,596.99
2012-02-01,458.41,547.61,453.98,542.44,22001000,540.12
2012-01-03,409.40,458.24,409.00,456.48,12949100,454.53
Overwriting data.csv
import pandas
df = pandas.read_csv('data.csv')
df
| Date | Open | High | Low | Close | Volume | Adj Close | |
|---|---|---|---|---|---|---|---|
| 0 | 2012-06-01 | 569.16 | 590.00 | 548.50 | 584.00 | 14077000 | 581.50 |
| 1 | 2012-05-01 | 584.90 | 596.76 | 522.18 | 577.73 | 18827900 | 575.26 |
| 2 | 2012-04-02 | 601.83 | 644.00 | 555.00 | 583.98 | 28759100 | 581.48 |
| 3 | 2012-03-01 | 548.17 | 621.45 | 516.22 | 599.55 | 26486000 | 596.99 |
| 4 | 2012-02-01 | 458.41 | 547.61 | 453.98 | 542.44 | 22001000 | 540.12 |
| 5 | 2012-01-03 | 409.40 | 458.24 | 409.00 | 456.48 | 12949100 | 454.53 |
6 rows × 7 columns
df[df.Date < '2012-03-01']
| Date | Open | High | Low | Close | Volume | Adj Close | |
|---|---|---|---|---|---|---|---|
| 4 | 2012-02-01 | 458.41 | 547.61 | 453.98 | 542.44 | 22001000 | 540.12 |
| 5 | 2012-01-03 | 409.40 | 458.24 | 409.00 | 456.48 | 12949100 | 454.53 |
2 rows × 7 columns
Build your own
import urllib2
import BeautifulSoup as bs


class CTPUG(object):
    def __init__(self):
        data = urllib2.urlopen('https://ctpug.org.za/wiki/OtherActivities').read()
        html = bs.BeautifulSoup(data)
        list_items = html.find(id='content').find('ul')
        links = [x.find('a') for x in list_items]
        self.games = [(game.text, game.get('href')) for game in links]

    def _repr_html_(self):
        out = '<h2>CTPUG Games Central</h2>'
        out += '<ul>'
        for (game, url) in self.games:
            out += '<li><a href="%s">%s</a></li>' % (url, game)
        out += '</ul>'

        return out
CTPUG()
Parallel processing
IPython supports many different styles of parallelism including:
- Single program, multiple data (SPMD) parallelism.
- Multiple program, multiple data (MPMD) parallelism.
- Message passing using MPI.
- Task farming.
- Data parallel.
- Combinations of these approaches.
- Custom user defined approaches.
Most importantly, IPython enables all types of parallel applications to be developed, executed, debugged and monitored interactively.
Concepts: engine, controller
The two primary models for interacting with engines are:
- A Direct interface, where engines are addressed explicitly.
- A LoadBalanced interface, where the scheduler is trusted with assigning work to appropriate engines.
From http://ipython.org/ipython-doc/dev/parallel/parallel_intro.html
%%script bash --bg

ipcluster start -n 4
Starting job # 0 in a separate thread.
from IPython.parallel import Client
rc = Client()
rc.ids
[0, 1, 2, 3]
Choice: load balanced scheduler or direct view?
dview = rc[:] # use all engines
dview
<DirectView [0, 1, 2, 3]>
Apply vs map
def hostname():
    import socket
    return socket.gethostname()
dview.apply_sync(hostname)
['shinobi', 'shinobi', 'shinobi', 'shinobi']
dview.map_sync(lambda x: x**2, range(16))
[0, 1, 4, 9, 16, 25, 36, 49, 64, 81, 100, 121, 144, 169, 196, 225]
Asynchronous execution
with dview.sync_imports():
    import time

# or import inside the function
importing time on engine(s)
def wait(t):
    tic = time.time()
    time.sleep(t)
    return (t, time.time() - tic)

results = dview.map_async(wait, np.random.random(10) * 5)
results
<AsyncMapResult: wait>
results.ready()
False
results.get()
[(0.32823493812546123, 0.3286170959472656),
 (1.2019458642642351, 1.2032179832458496),
 (4.6658318845027766, 4.667338132858276),
 (0.92740250323901152, 0.9284038543701172),
 (1.5263812870458282, 1.5279979705810547),
 (1.6983371074710696, 1.699779987335205),
 (4.4520196848462952, 4.452850103378296),
 (0.94553497074157944, 0.9465329647064209),
 (4.212111324372759, 4.2164390087127686),
 (4.8820578043240479, 4.885134935379028)]
Define functions for parallel execution
@dview.remote(block=True)
def getpid():
    import os
    return os.getpid()
getpid()
[7688, 7689, 7690, 7698]
import numpy as np
A = np.random.random((64, 48))

# parallel -> only for element-wise operations
#          -> automatically breaks up input into chunks
@dview.parallel(block=True)
def pmul(A, B):
    return A*B
(pmul(A, A) == A * A).all()
True
dview.scatter('x', range(16))
<AsyncResult: scatter>
%%px

[i**2 for i in x]
Out[0:1]: [0, 1, 4, 9]
Out[1:1]: [16, 25, 36, 49]
Out[2:1]: [64, 81, 100, 121]
Out[3:1]: [144, 169, 196, 225]
%%px

y = [i**2 for i in x]
y = dview.gather('y')
y
<AsyncMapResult: gather>
y.get()
[0, 1, 4, 9, 16, 25, 36, 49, 64, 81, 100, 121, 144, 169, 196, 225]
Widgets: merged today
%matplotlib inline
import matplotlib.pyplot as plt
import numpy as np

from IPython.html.widgets import interact, interactive, fixed
from IPython.display import display
from IPython.html.widgets import FloatSlider, HTMLWidget
import skimage
from skimage import data, filter, io, img_as_float
from skimage import exposure

i = img_as_float(data.coffee())

plt.imshow(i);

def edit_image(image, sigma=0.1, r=1.0, g=1.0, b=1.0, gamma=1,
                      interpolation={'Nearest Neighbor': 'nearest',
                                     'Linear': 'bilinear',
                                     'Cubic': 'bicubic'},
                      zoomed=False):
    new_image = image

    if zoomed:
        new_image = new_image[55:75, 55:75]

    new_image = filter.gaussian_filter(new_image, sigma=sigma, multichannel=True)

    new_image[:,:,0] = r*new_image[:,:,0]
    new_image[:,:,1] = g*new_image[:,:,1]
    new_image[:,:,2] = b*new_image[:,:,2]

    new_image = np.clip(new_image, 0, 1)

    new_image = exposure.adjust_gamma(new_image, gamma)

    plt.imshow(new_image, interpolation=interpolation)
    plt.show()

    return new_image

r = FloatSlider(min=0, max=2, step=0.1, value=1)
g = FloatSlider(min=0, max=2, step=0.1, value=1)
b = FloatSlider(min=0, max=2, step=0.1, value=1)

w = interactive(edit_image, image=fixed(i),
                sigma=(0, 2, 0.1),
                r=r, g=g, b=b, gamma=(0.0, 1.0, 0.1))

w.children = [HTMLWidget(value='<h3>Exploring image adjustment</h3>')] + list(w.children)

display(w)

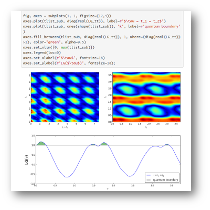
def fourier(X, n):
    plt.plot(x, 'b')

    N = len(X)
    zeros = (N - n) // 2

    X = X.copy()
    X[N//2 - zeros:N//2 + zeros] = 0

    x_ = np.abs(np.fft.ifft(X))

    plt.plot(x_, 'r')
    plt.show()
    return x

x = np.zeros(1000)
x[300:600] = 1

X = np.fft.fft(x)
w = interactive(fourier, X=fixed(X), n=(0, 200))
display(w)
