Room Impulse Responses (RIRs)
To measure the impulse response of a room (more precisely: the impulse response from one specific point in the room to another specific point in the room), the room can be excited with an impulse (or bang) and the result (= the impulse response) can be recorded with a microphone.
A Very Simple Measurement Procedure
In this unit we will measure the impulse response of our seminar room. There are several possibilities to excite the room - bursting balloons, gunshots, electrical spark discharges, ...; for simplicity (and for safety reasons), we use two wooden boards which we clap together.
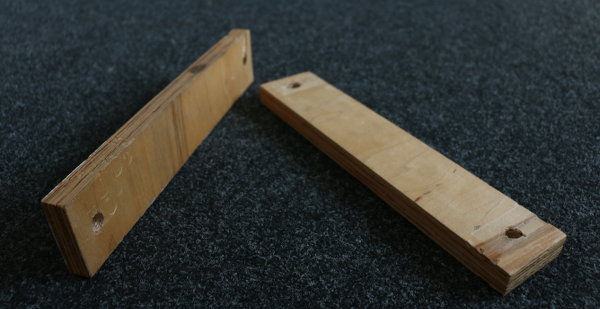
That's not ideal - ideally all frequencies should be excited equally - but it shall be sufficient for demonstration purposes.
We will record the room response with the software Audacity and export the result as WAV file (using the menu "File" $\to$ "Export Audio..." or "Export Selected Audio...").
As we will see in a later unit, there are much better ways to measure room impulse responses!
If you are not able to join us for the measurement, you can still try the following exercises with this example room impulse response: data/rir_clap.wav.
Listening to the Room Impulse Response
Exercise: Listen to the WAV file containing the impulse response. Do you get a clear impression about the recorded room?
Exercise: Convolve the measured impulse response with different audio signals (see the data/ directory for some example WAV files) and listen to the respective results.
Does it sound like the measured room? If not, what's different?
If the resulting signal is too soft or too loud, you can normalize it with the function tools.normalize() (defined in tools.py).
import tools
tools.normalize?
Plotting the Room Impulse Response
Exercise: Plot the impulse response; once with linear amplitude and once in decibel. Which is more meaningful?
A Function for Plotting
Exercise: Write a function called plot_impulse_response(), which plots a given impulse response with the following properties:
The x-axis shall be labelled with the time in milliseconds.
The y-axis shall be labelled with the amplitude in dB, in a way that the absolute maximum of the impulse response is at 0 dB.
Estimating the Reverberation Time
Exercise: Just by looking at the figure, try to estimate the reverberation time $T$ (sometimes also called $RT$). This is the time in which the level has decreased by 60 dB after the maximum level (corresponding to the direct sound component). If the SNR isn't good enough, you might also look at the time until -30 dB are reached and multiply this time by 2 (this is called $T_{30}$).
Let's do it in a more systematic way. The time profile of the energy can be represented by the normalized energy decay curve (EDC) defined as
$$ L(t) := \frac{\int_{t}^{\infty} h^2({\tau}) d\tau}{\int_{0}^{\infty} h^2({\tau}) d\tau}. $$Note that the denominator normalizes the energy so that $L(t)$ is unity (0 dB) at $t=0$. In practice, the integrals can be evaluated only within a limited time interval, so $\infty$ needs to be replaced by a practical value $t_\rm{end}$.
Exercise: Complete the function energy_decay_curve.
def energy_decay_curve(ir):
    L = np.zeros_like(ir)

#     ???

    return L / L[0]
Exercise: Plot the energy_decay curve of the impulse response in decibel. Since $L(t)$ represents the energy of the impulse response, $10\log_{10}(\cdot)$ should be used instead of $20\log_{10}(\cdot)$.
Please check the following.
- Does $L(t)$ decrease monotonically?
- Is it 0 dB at $t=0$?
- Is it easier to estimate the reverberation time $T$ by visual inspection?
Exercise: Compute reverberation time RT20 by using the function tools.rt20. Try different values for t0 and see how the resulting reverberation time changes.
According to the stardard ISO 3382, the reverberation time has to be computed for 1 or 1/3-octave bands. Also the results must be averaged for several source and receiver positions. Here we estimated the reverberation time from a single impulse response and the whole audible frequency range was considered for conveience.
Surfing the Web
In the interwebs, there are many places where you can find room impulse responses.
A few suggestions:
Pori Concert Hall
overview http://www.acoustics.hut.fi/projects/poririrs/
download http://legacy.spa.aalto.fi/projects/poririrs/wavs/omni.zip
extract
s1_r1_o.wavconvert from stereo to mono
SpACE-Net
Maes Howe http://www.space-net.org.uk/node/51/index.html
- download B-format: W and X Channels, but only use the "W" channel
Hamilton Mausoleum http://www.space-net.org.uk/node/52/index.html
- download B-format: W and X Channels, but only use the "W" channel
St Andrew's Church http://www.space-net.org.uk/node/53/index.html
- download B-format: W and X Channels, but only use the "W" channel
York Minster http://www.space-net.org.uk/node/54/index.html
- download B-format: W and X Channels, but only use the "W" channel
EMES Virtual Rooms
a few free IRs http://www.emes.de/pageseng/products/Impulsresponse/eimpulse.htm
information http://www.emes.de/pdf/Freesampletxt2-1.pdf
one example WAV http://www.emes.de/impulsefiles/Gothic%20Church.wav
- convert from stereo to mono
Aachen Impulse Response Database
The World's Longest Reverb
Exercise: Download some of them (maybe not the world's longest reverb), listen to them, plot them and estimate their reverberation time $T$.
Can you recognize the direct sound, the early reflections and the late reverb?
Solutions
If you had problems solving some of the exercises, don't despair! Have a look at the example solutions.

To the extent possible under law,
the person who associated CC0
with this work has waived all copyright and related or neighboring
rights to this work.