import networkx as nx

'''use g = nx.Graph() to create a graph'''

g = nx.Graph()

'''Lesson: use .add_node(1) to add a single node'''

# TODO: add a node

'''Lesson: use .add_nodes_from([2, 3, 'four', 5])  to add in bulk'''

# TODO: add multiple nodes


g.nodes()  # run g.nodes() to view the graph
'''Note that NetworkX won't complain if we re-add pre-existing nodes'''

# TODO: try re-adding nodes to see what happens


g.nodes()  # display nodes
'''Lesson: remove syntax is similar to adding, eg:
        .remove_node()
        .remove_nodes_from()
'''

# TODO: try removing both 1) single nodes, 2) nodes in bulk


g.nodes()  # display nodes
Adding & editing edges
h = nx.Graph()  # let's create a 2nd graph to play with edges

'''Lesson: to create an edge, just specify the 2 nodes that define it:
        .add_edge('a','b')
    Note that those nodes also get added (no need to make them beforehand!)
'''

# TODO: create an edge


print 'edges:', h.edges()  # see your new edge
print 'nodes:', h.nodes()  # verify that new nodes were also added
'''Lesson: adding multiple edges is similar to adding multiple nodes:
        .add_edges_from([('x','y'), ('y','z')])
'''

# TODO: create multiple new edges


print 'edges:', h.edges()  # see your new edge
print 'nodes:', h.nodes()  # verify that new nodes were also added
Visualizing graphs
# we need this 'magic' command to draw graphs inline
%matplotlib inline

GREEN = "#77DD77"
BLUE = "#99CCFF"

nx.draw(g, node_color=GREEN, with_labels=True)
nx.draw(h, node_color=BLUE, with_labels=True)

# TODO: nothing to write, just run this :)
Mini Quiz!
How would you create the following graph?

g = nx.Graph()

# TODO: create the graph illustrated above

nx.draw(g, node_color=BLUE, with_labels=True)
Directed Graphs
'''Lesson: use nx.DiGraph() to create a new directed graph
'''

# TODO: create a directed graph
dg =


dg.add_edges_from([(1,2), (2,3)])

# TODO: run this cell, you should see 2 directed edges

print 'directed edges:', dg.edges()
nx.draw(dg, node_color=GREEN, with_labels=True)
'''We can make directed graphs from existing graphs, eg:
        nx.DiGraph(g)
'''

# TODO: create a directed graph from g
dg = nx.DiGraph(g)


nx.draw(dg, node_color=BLUE, with_labels=True)
''' Notice that nodes A and B have TWO directed edges:
        A -> B
        B -> A
'''

# TODO: run dg.edges() to confirm that each node pair has TWO directed edges
dg.edges()
Adding attributes to nodes and edges
Sometimes you may want to attach attributes to either the nodes or edges:
- Perhaps you want to save node properties that will be helpful with future analysis
- Perhaps you want to attach visual descriptions, such a node size, edge width or graph color
cities = nx.Graph()

cities.add_edge('San Diego', 'Los Angeles', { 'distance': 0.4})
cities.add_edge('New York', 'Nashville', { 'distance': 5.6})
cities.add_edge('Boston', 'D.C.', { 'distance': 0.8})

nx.draw(cities)
Describing a Network
Degree Distribution:
- 1 node with 4 edges
- 1 node with 2 edges
- 4 nodes with 1 edge
Distribution:
[(1:4), (1:2), (4:1)]
# Degree Distribution for all nodes
print 'Degree Distribution:', g.degree()
Degree Distribution: {'A': 1, 'C': 1, 'B': 2, 'E': 1, 'D': 4, 'F': 1}

# Generate the graph above
paths = nx.Graph()
paths.add_edges_from([
    ('A','B'), ('B','D'), ('B','C'), ('D','E'), ('D','C'),
    ('C','1'), ('1','2'), ('1','3'), ('2','3'),
    ('E','2'), ('E','4')])

# Display average shortest path details
print 'Avg shortest path from A to E is', nx.shortest_path_length(paths, 'A','E'), 'hops:'
print nx.shortest_path(paths, 'A','E')
Avg shortest path from A to E is 3 hops:
['A', 'B', 'D', 'E']
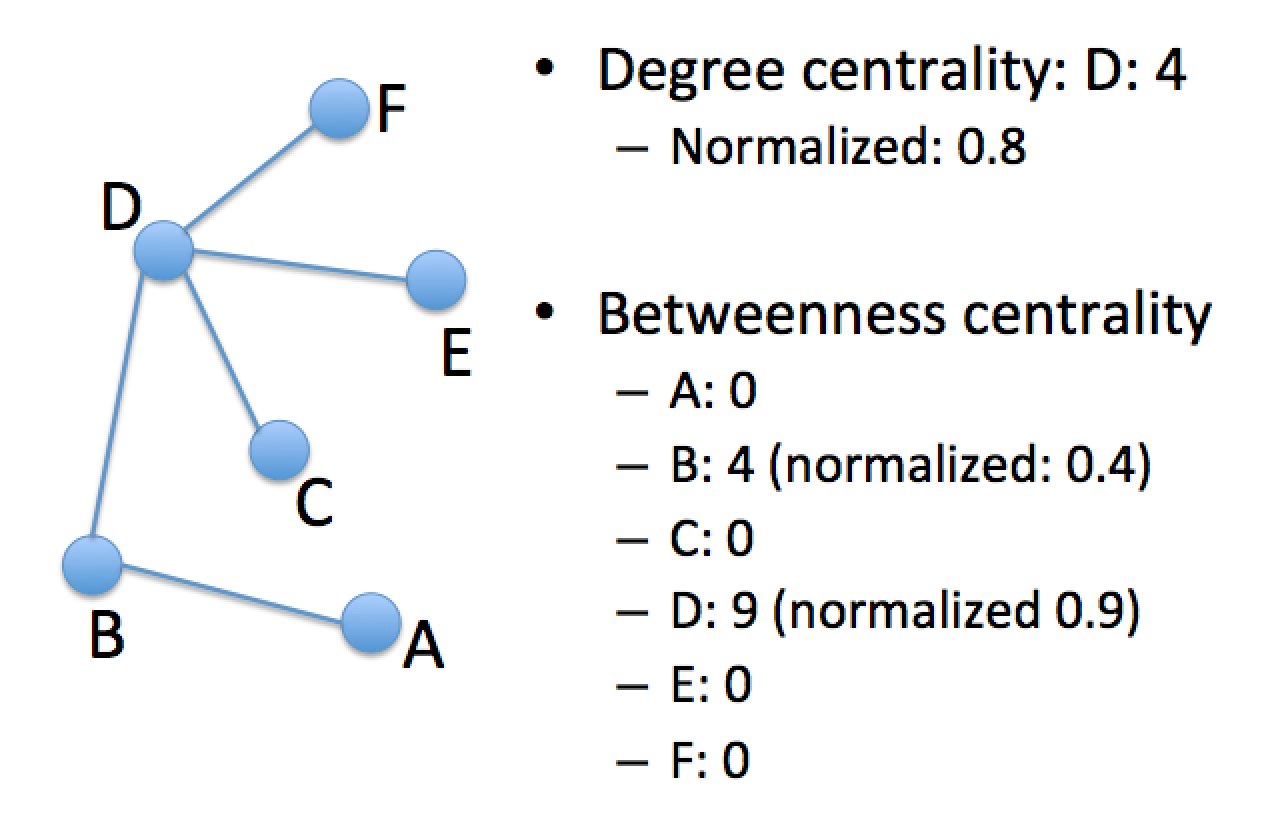
Network Centrality (the higher result is better!)
- Degree: number of edges for node X
- Betweenness: number of shortest paths that pass through node X
- Closeness: average of the shortest paths between X and all other nodes

''' To calculate Degree Distribution for all nodes, use:
    g.degree()  for non-normalized values,
    nx.degree_centrality(g)   for normalized values
'''

# TODO degree distrib., non-normalized

# TODO degree distrib., normalized
Degree:
	{'A': 1, 'C': 1, 'B': 2, 'E': 1, 'D': 4, 'F': 1}
Degree centrality (normalized):
	{'A': 0.2, 'C': 0.2, 'B': 0.4, 'E': 0.2, 'D': 0.8, 'F': 0.2}
Betweenness centrality:
	{'A': 0.0, 'C': 0.0, 'B': 4.0, 'E': 0.0, 'D': 9.0, 'F': 0.0}
Betweenness centrality -- normalized:
	{'A': 0.0, 'C': 0.0, 'B': 0.4, 'E': 0.0, 'D': 0.9, 'F': 0.0}
Closeness centrality:
	{'A': 0.4166666666666667, 'C': 0.5, 'B': 0.625, 'E': 0.5, 'D': 0.8333333333333334, 'F': 0.5}
''' To calculate betweenness centrality, use:
    nx.betweenness_centrality(g, normalized=True/False)   default is True
'''

# TODO find betweenness centrality (both normalized and non)
''' to calculate closeness centrality, use:
    nx.closeness_centrality(g)
'''

# TODO find closeness centrality
Intro to the Twitter API
In order to use the Twitter API, you'll need:
- import oauth2 (pip install oauth2)
- A twitter account
- Twitter Consumer/Access tokens
Creating your Twitter Consumer/Access Tokens
- Go to https://apps.twitter.com/ and click "Create New App"
- Twitter assumes you're making tokens for an app, so let's make a dummy app.
- Fill out Name, Description and Website:
- For Website, I just put my github/twitter link
- I left Callback URL empty
- Click "Create your Twitter Application"
- Under Application Settings, set Access level to Read-only:
- You don't have to do this, but it's good practice.
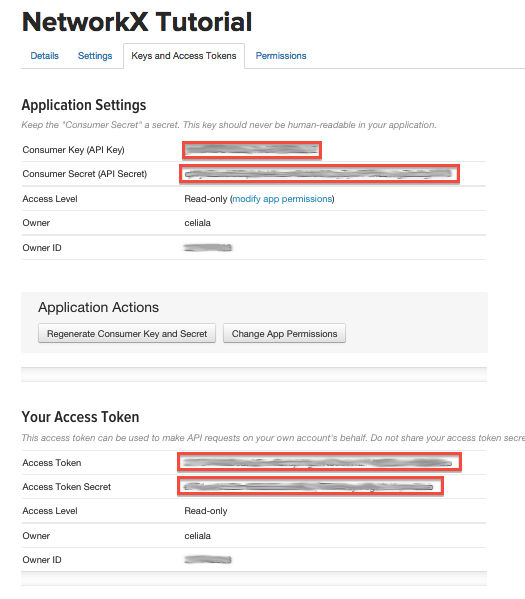
- Notice that we're in the Details tab. Click on the Keys and Access Tokens tab:
- You'll see Consumer Key (API Key) and Consumer Secret (API Secret). We'll copy those in a second.
- Scroll to the bottom of the page and click the "Create my access token" button (under Your Access Token > Token Actions)
Keep this page open - we'll paste these values into a config file.
Adding your Twitter API tokens into config.json
Using a text editor, open networkx-tutorial/materials/config.json, and paste your keys for the following:
- CONSUMER_KEY - replace "[Consumer Key (API Key)]" with your value for "Consumer Key (API Key)"
- CONSUMER_SECRET
- ACCESS_TOKEN
- ACCESS_SECRET
Connecting to the Twitter API
Now we're ready to use the Twitter API!
import oauth2 as oauth
import json

with open('../materials/tutorial/config.json') as f:
    tokens = json.loads(f.read())

consumer = oauth.Consumer(key=tokens['CONSUMER_KEY'], secret=tokens['CONSUMER_SECRET'])
token = oauth.Token(key=tokens['ACCESS_TOKEN'], secret=tokens['ACCESS_SECRET'])

client = oauth.Client(consumer, token)

# TODO: run this... should get an <OAuth2.Client> object connecting to Twitter's API
client
Twitter's REST APIs
Twitter has a rich set of API calls (full list is listed at https://dev.twitter.com/rest/public). Today we'll be using these:
- GET friends/list - who is user X is following?
- GET followers/list - who follows user X?
GET followers/list: let's find out who follows you!
You'll see from the GET followers/list documentation that the URL to get the list of followers is:
https://api.twitter.com/1.1/followers/list.json?screen_name=[screen_name]
Which returns:
- A response body
- JSON representing the data we requested
- A response header
There's a lot of stuff here, but one param to note are the HTTP Response Codes, which will tell you if the request was successful. Or if not, why. The ones you should note are:
200 - STATUS_OKAY - Success :) . This is what you want.
429 - RATE_LIMIT_EXCEEDED. Uh-oh, slow it down :/. Twitter limits how frequently you can make requests, and you've exceeded it.
401 - UNAUTHORIZED_USER. Twitter isn't accepting your Consumer/Access tokens. Verify tokens were pasted correctly, or try generating new tokens.
Now that we know what to expect, let's try it!
import json

FOLLOWERS_URL = 'https://api.twitter.com/1.1/followers/list.json'

#  TODO: put your twitter handle here
screen_name = 'my_twitter_handle'


url = FOLLOWERS_URL + '?screen_name=' + screen_name
header, response = client.request(url, method='GET')

# let's save the whole response so you can take a look at it
with open('../materials/tutorial/my_followers.json', 'w') as f:
    json.dump(json.loads(response), f, indent=2)

print 'status:', header['status'] # should be 200 (STATUS_OKAY)
print response[:200] # a lot of data!
Extracting data from JSON result
'my_followers.json' will look like the example below. Let's extract the values in RED:
{
  "previous_cursor": 0,
  "previous_cursor_str": "0",
  "next_cursor": 1496386282559075381,  # use next_cursor to get the next page of results
  "users": [
    {
      ...
      "screen_name": "celiala",  # follower 1
      ...
    },
    {
      ...
      "screen_name": "sarah_guido",  # follower 2
      ...
    }
  ],
  ...
}
Let's extract next_cursor and the list of followers:
data = json.loads(response) # convert JSON string into a dictionary object

next_cursor = data['next_cursor']
followers = [u['screen_name'] for u in data['users']]

# TODO: run this block to see what's in next_cursor and followers:
print 'next_cursor:', next_cursor
print len(followers), 'followers so far:', followers
Generating the subsequent Twitter API call
To get the next page of results, simply pass next_cursor as your next cursor value:
# use next_cursor to get next 20 results
url = FOLLOWERS_URL + '?screen_name=' + screen_name + '&cursor=' + str(next_cursor)
header, response = client.request(url, method='GET')

if header['status'] == '200':  # STATUS_OKAY

    data = json.loads(response) # convert JSON to dictionary object

    next_cursor = data['next_cursor']
    new_followers = [u['screen_name'] for u in data['users']]
    followers.extend(new_followers)

    # save raw JSON
    with open('../materials/tutorial/my_followers.' + str(next_cursor) + '.json', 'w') as f:
        json.dump(data, f, indent=2)

    # save followers so far
    with open('../materials/tutorial/my_followers.txt', 'w') as f:
        f.write('\n'.join(followers))

    print 'next_cursor:', next_cursor
    print len(new_followers), 'new followers:', new_followers

else:
    print header, response
Now we can just pass the screen_name and next_cursor, until we no longer get back a next_cursor.
Beware of Rate Limiting! - GET followers/list only allows 15 calls in a 15-min window. So, you may want to sleep between calls (time.sleep(seconds_to_sleep))
Twitter Interactive Console
To explore the other API Endpoints, Twitter has a great interactive UI console, where you can tweak the inputs and see the outputs:
At this point, switch to lesson.ipynb!!!
Go to lesson iPython notebook: /notebooks/notebooks/lesson.ipynb
import networkx as nx

# we need this 'magic' command to draw graphs inline
%matplotlib inline

g = nx.Graph()

# let's attach a size attribute to each node to describe how big we want the node to be
g.add_node(1, {'size': 800})
g.add_node(2, {'size': 200})
g.add_node(3, {'size': 200})
g.add_node(4, {'size': 200})
g.add_node(5, {'size': 200})

g.add_edge(1,2, { 'thickness': 20})
g.add_edge(1,3, { 'thickness': 20})
g.add_edge(1,4, { 'thickness': 20})
g.add_edge(1,5, { 'thickness': 20})
g.add_edge(2,3, { 'thickness': 5})
g.add_edge(3,4, { 'thickness': 5})
g.add_edge(4,5, { 'thickness': 5})
g.add_edge(5,2, { 'thickness': 5})

# let's iterate through the nodes and edges and extract the list of node & edge sizes
node_size = [attribs['size'] for (node, attribs) in g.nodes(data=True)]
edge_thickness = [attribs['thickness'] for (v_from, v_to, attribs) in g.edges(data=True)]

LIGHT_BLUE = '#A0CBE2'

nx.draw(g,
    node_size = node_size,   # node_size can either take a single value (where all nodes will be size N),
                             # or a list of values, where Nth list value will be the size for the Nth node
    width = edge_thickness,  # similarly, the Nth value corresponds to the width for edge N
    node_color = LIGHT_BLUE,
    edge_color = LIGHT_BLUE,
    font_size = 15,
    with_labels = True
)
import networkx as nx
import matplotlib.pyplot as plt

edgelist_txt = '../../data/retweets.txt'
G = nx.read_edgelist(edgelist_txt, create_using=nx.DiGraph())
LAYOUTS = {
'circular': nx.circular_layout,
'fr': nx.fruchterman_reingold_layout,
'random': nx.random_layout,
'shell': nx.shell_layout,
'spectral': nx.spectral_layout,
'spring': nx.spring_layout
}
def save_layout(G, layout_name):
elarge=[(u,v) for (u,v,d) in G.edges(data=True) if d['weight'] >1.5]
esmall=[(u,v) for (u,v,d) in G.edges(data=True) if d['weight'] <=1.5]
nlarge=[n for n in G.nodes() if n in ['PyTennessee']]
pos=LAYOUTS[layout_name](G) # positions for all nodes
print nlarge
# nodes
nx.draw_networkx_nodes(G,pos,nodelist=nlarge,node_size=1)
# edges
nx.draw_networkx_edges(G,pos,edgelist=elarge, width=1)
nx.draw_networkx_edges(G,pos,edgelist=esmall, width=1,alpha=0.5,edge_color='#cccccc')
# labelsM
labels={}
labels['PyTennessee']='PyTennessee'
nx.draw_networkx_labels(G,pos,labels,font_size=6)
#nx.draw_networkx_labels(G,pos,nodelist=nlarge,font_size=6,font_family='sans-serif')
plt.axis('off')
plt.savefig(layout_name + '.png', dpi=500)
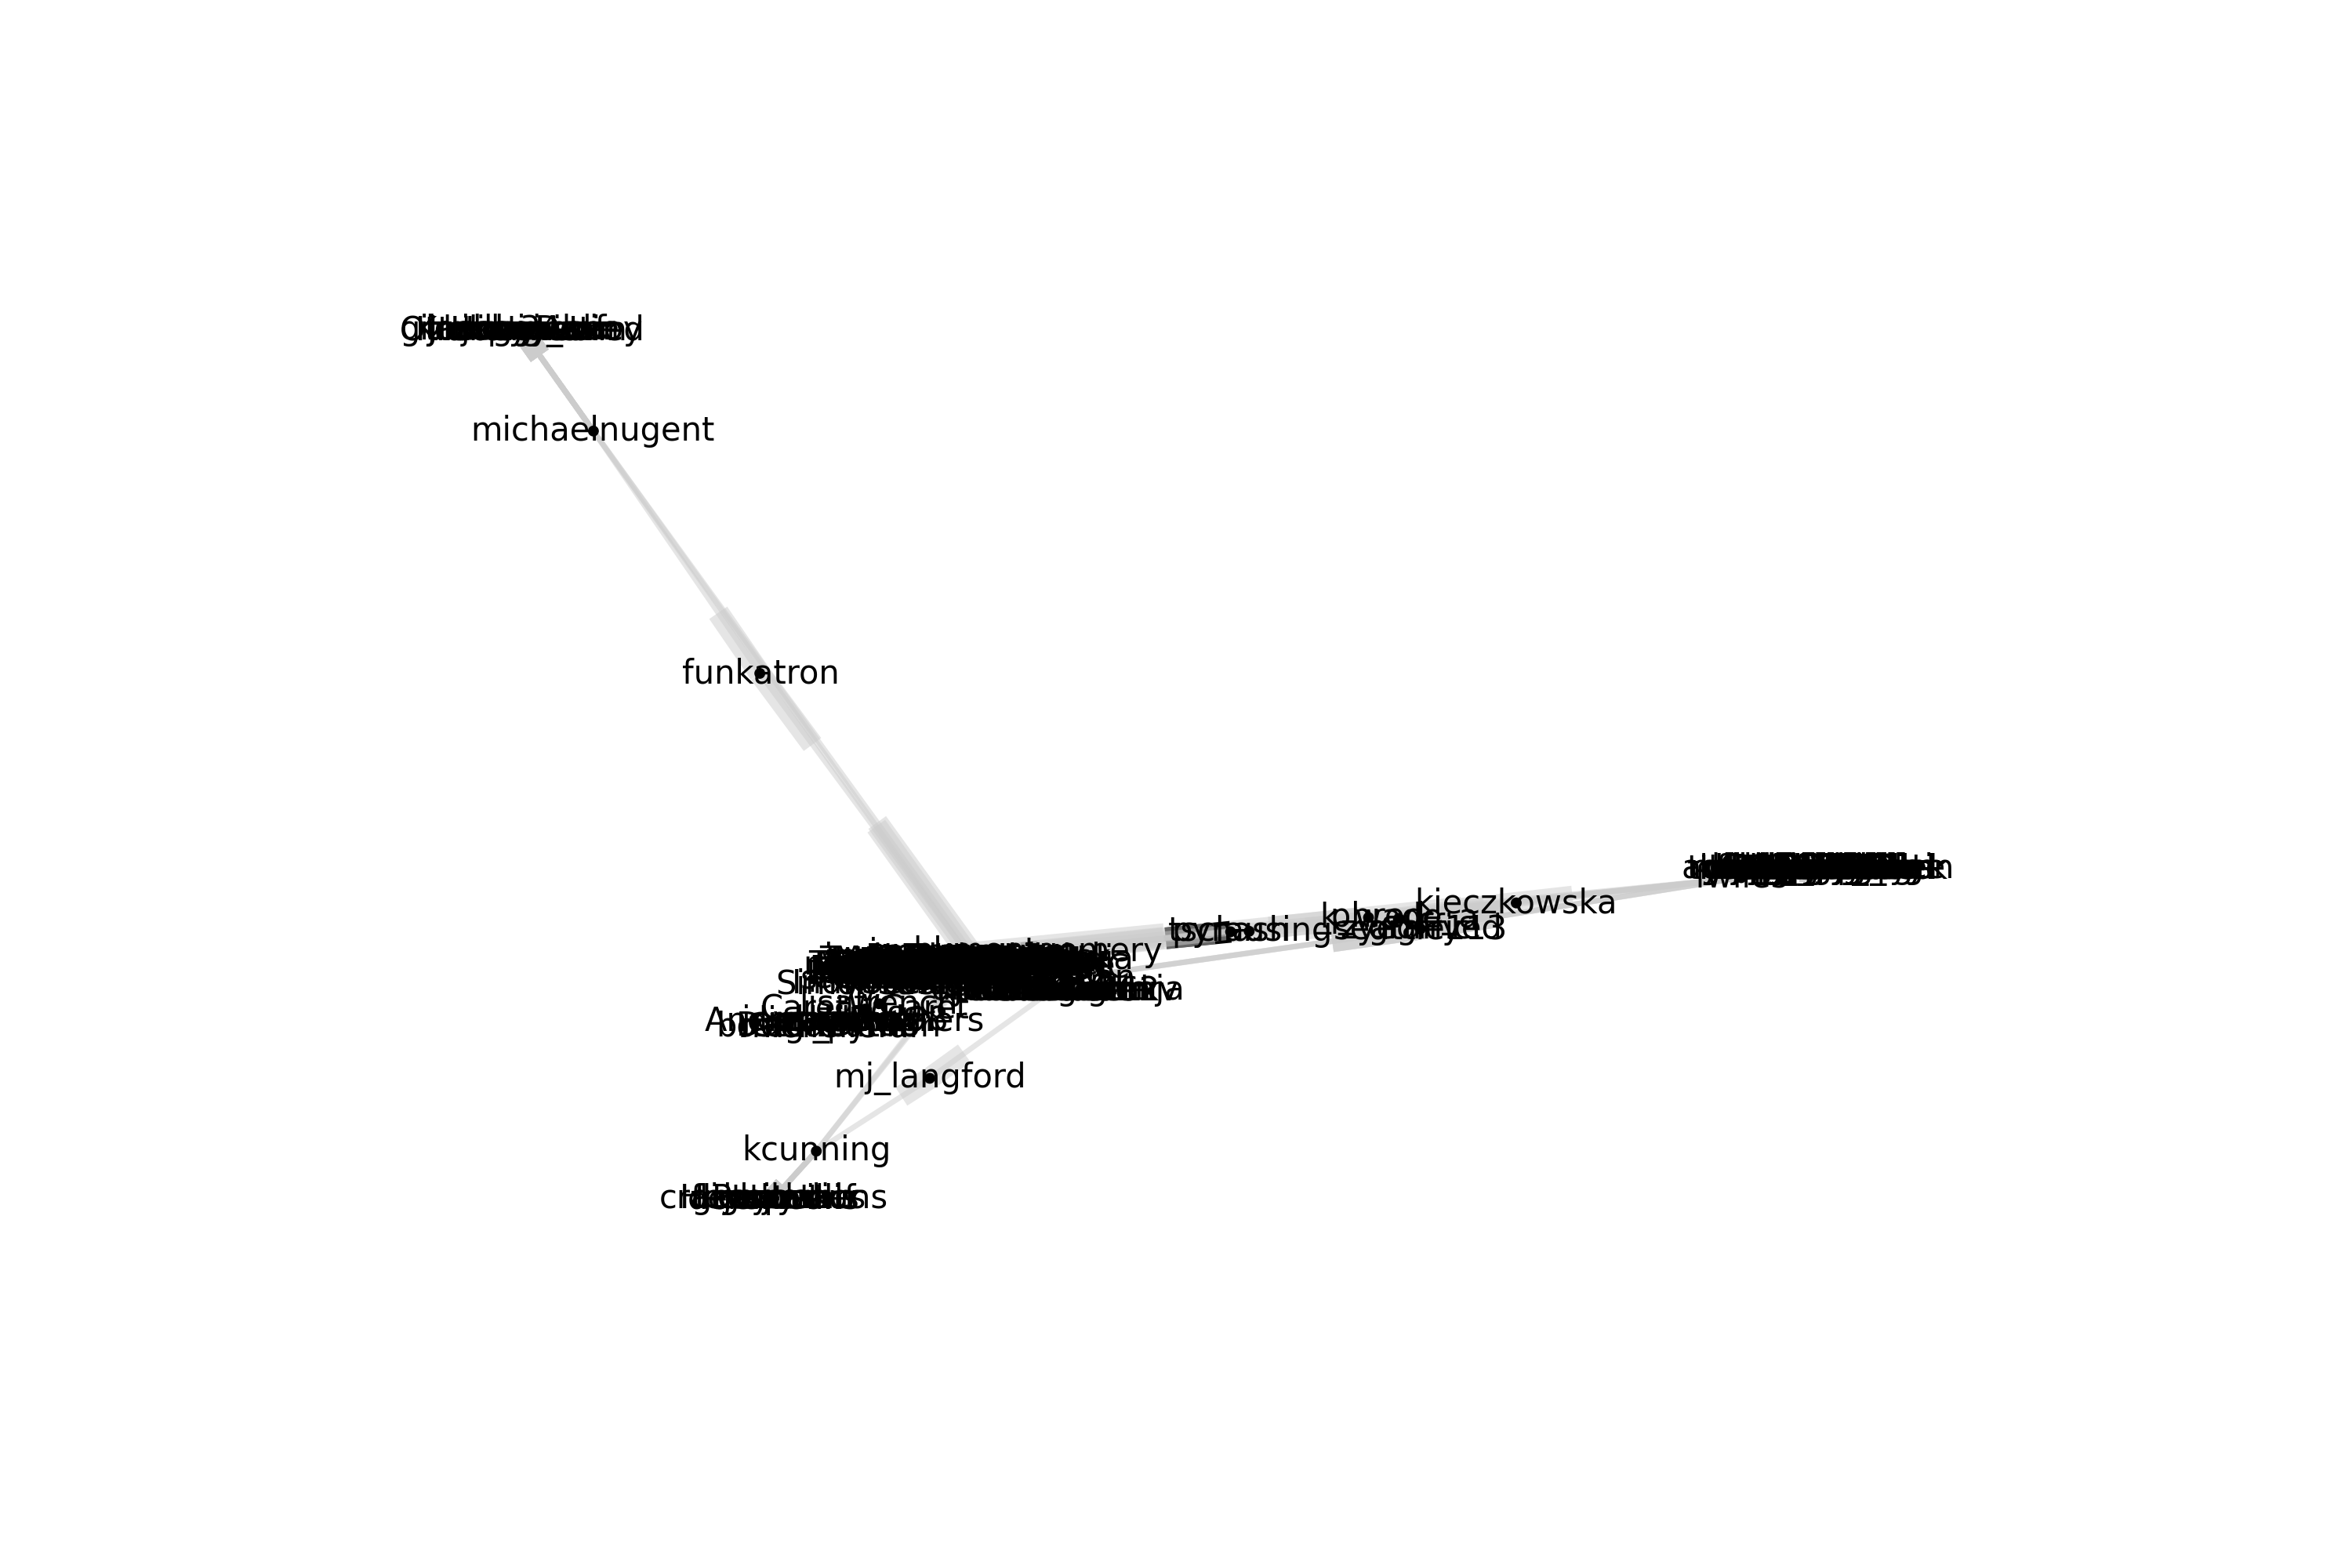
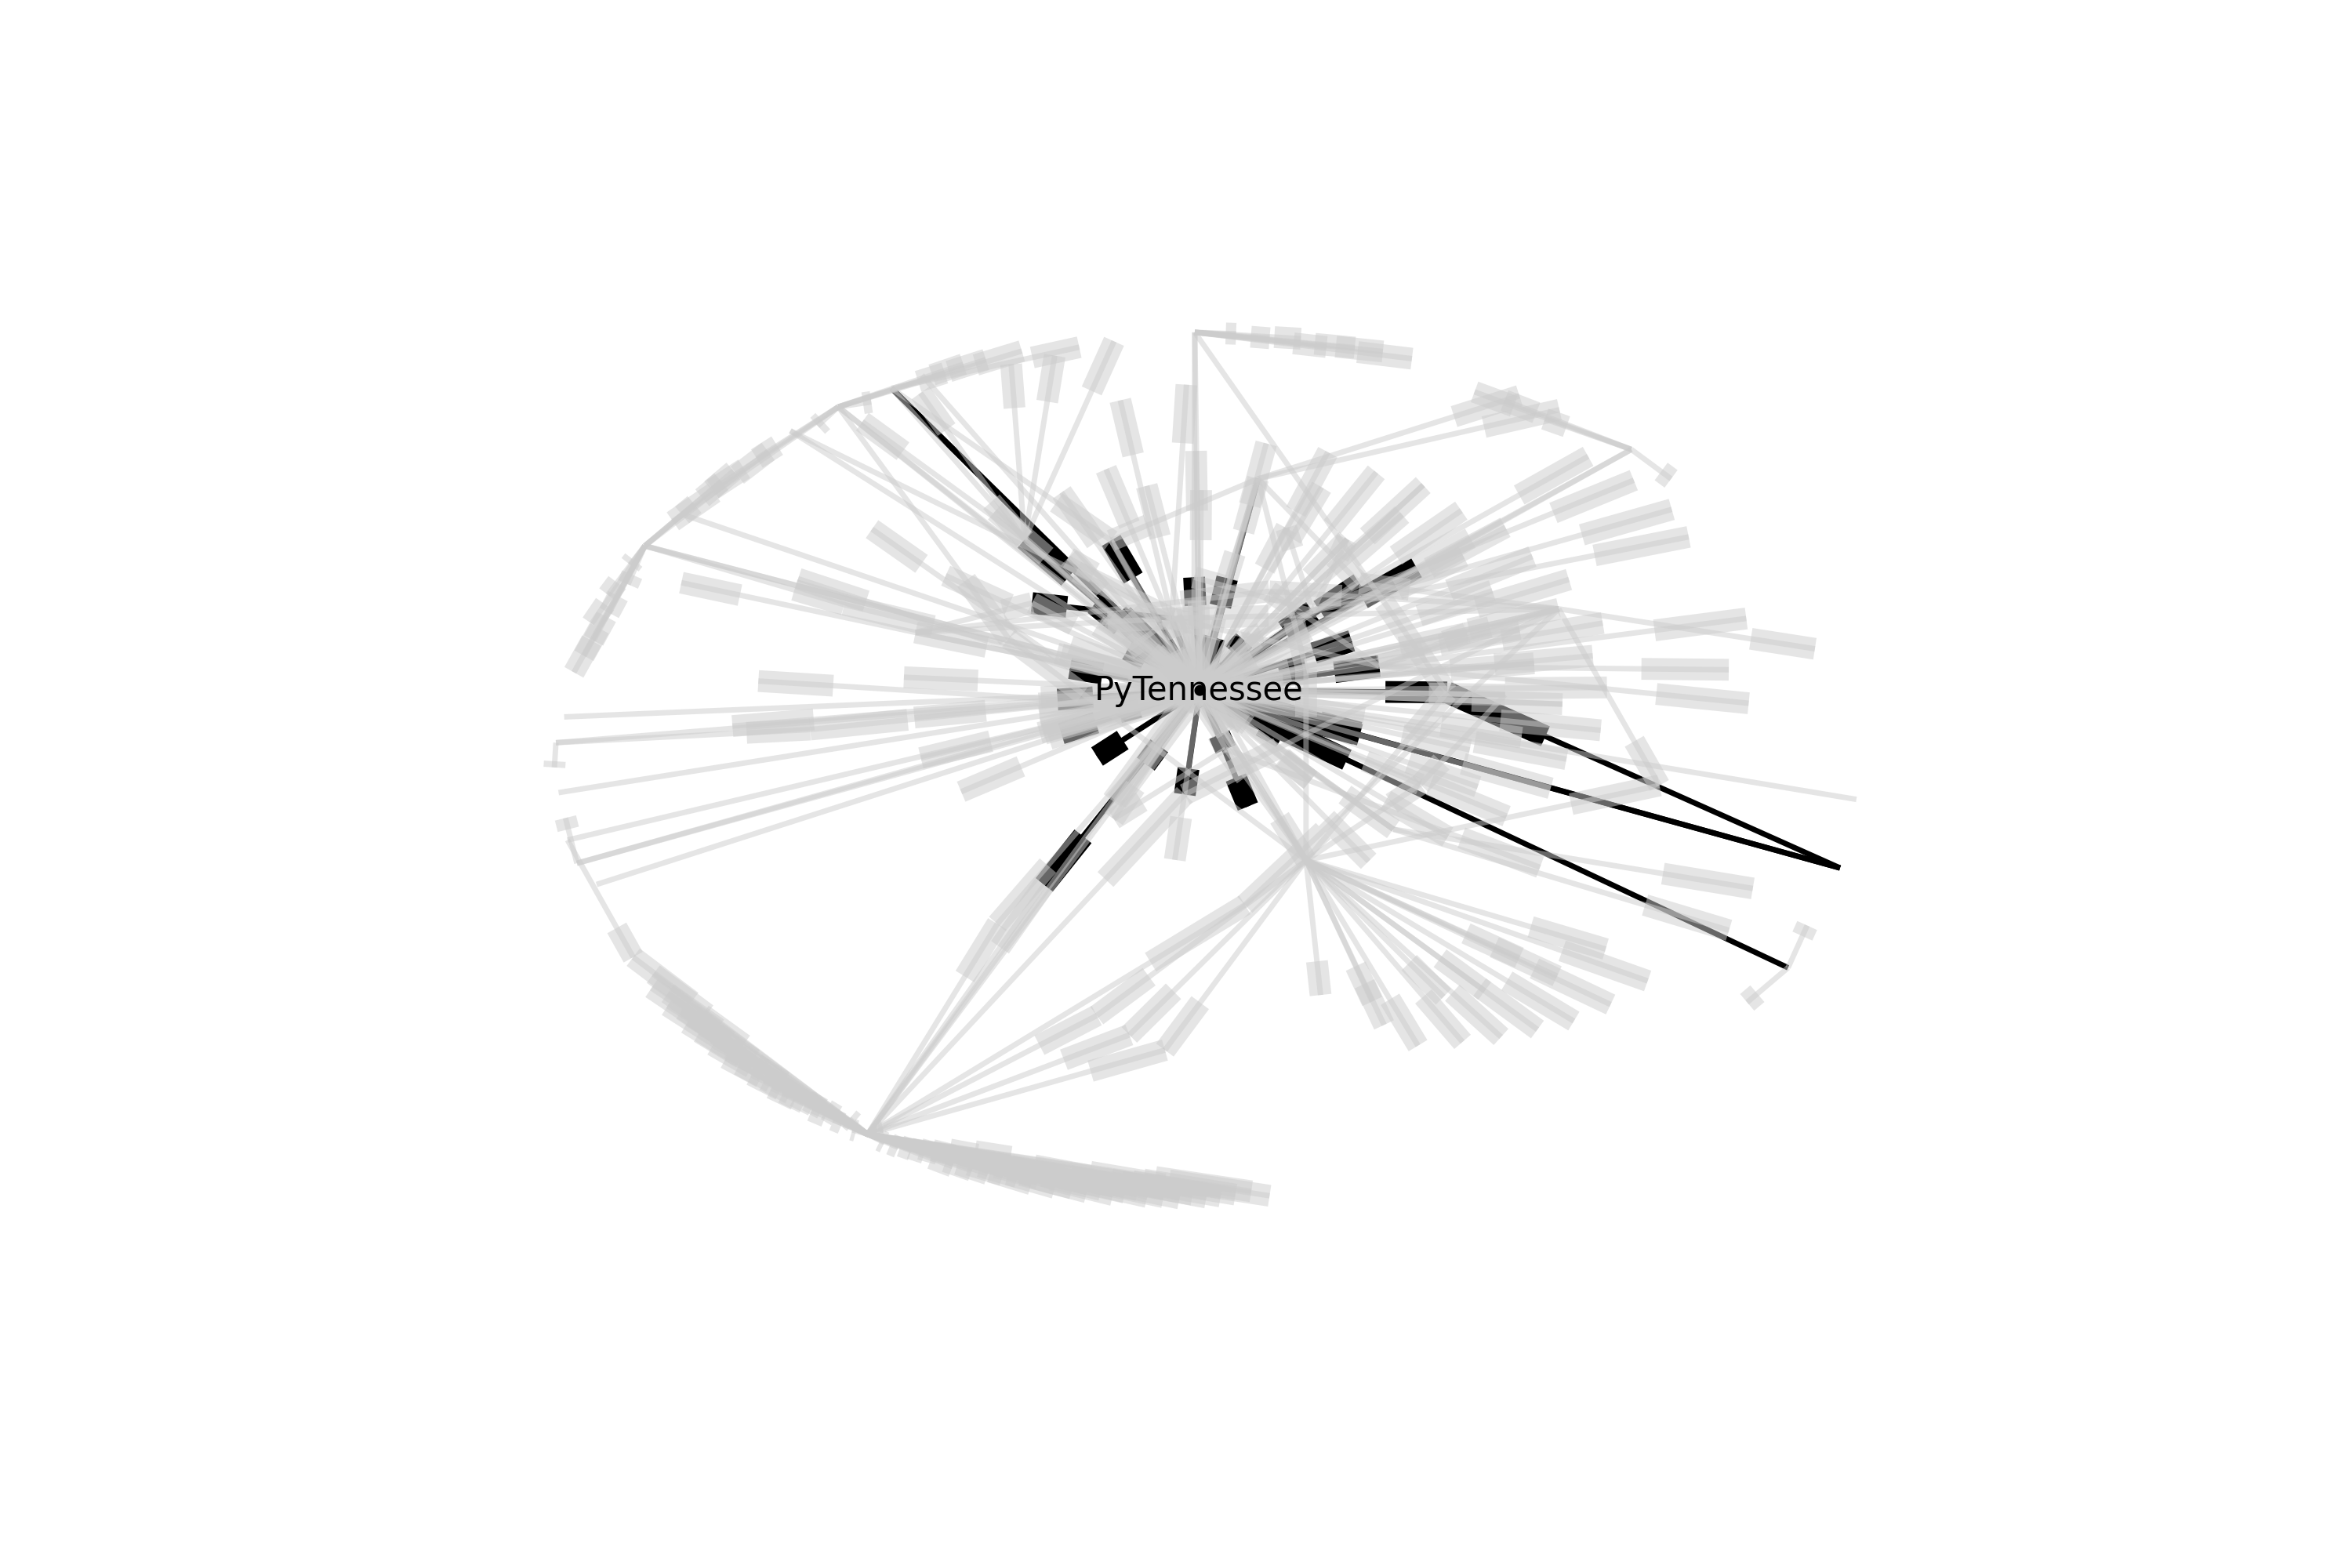
save_layout(G, 'spring')
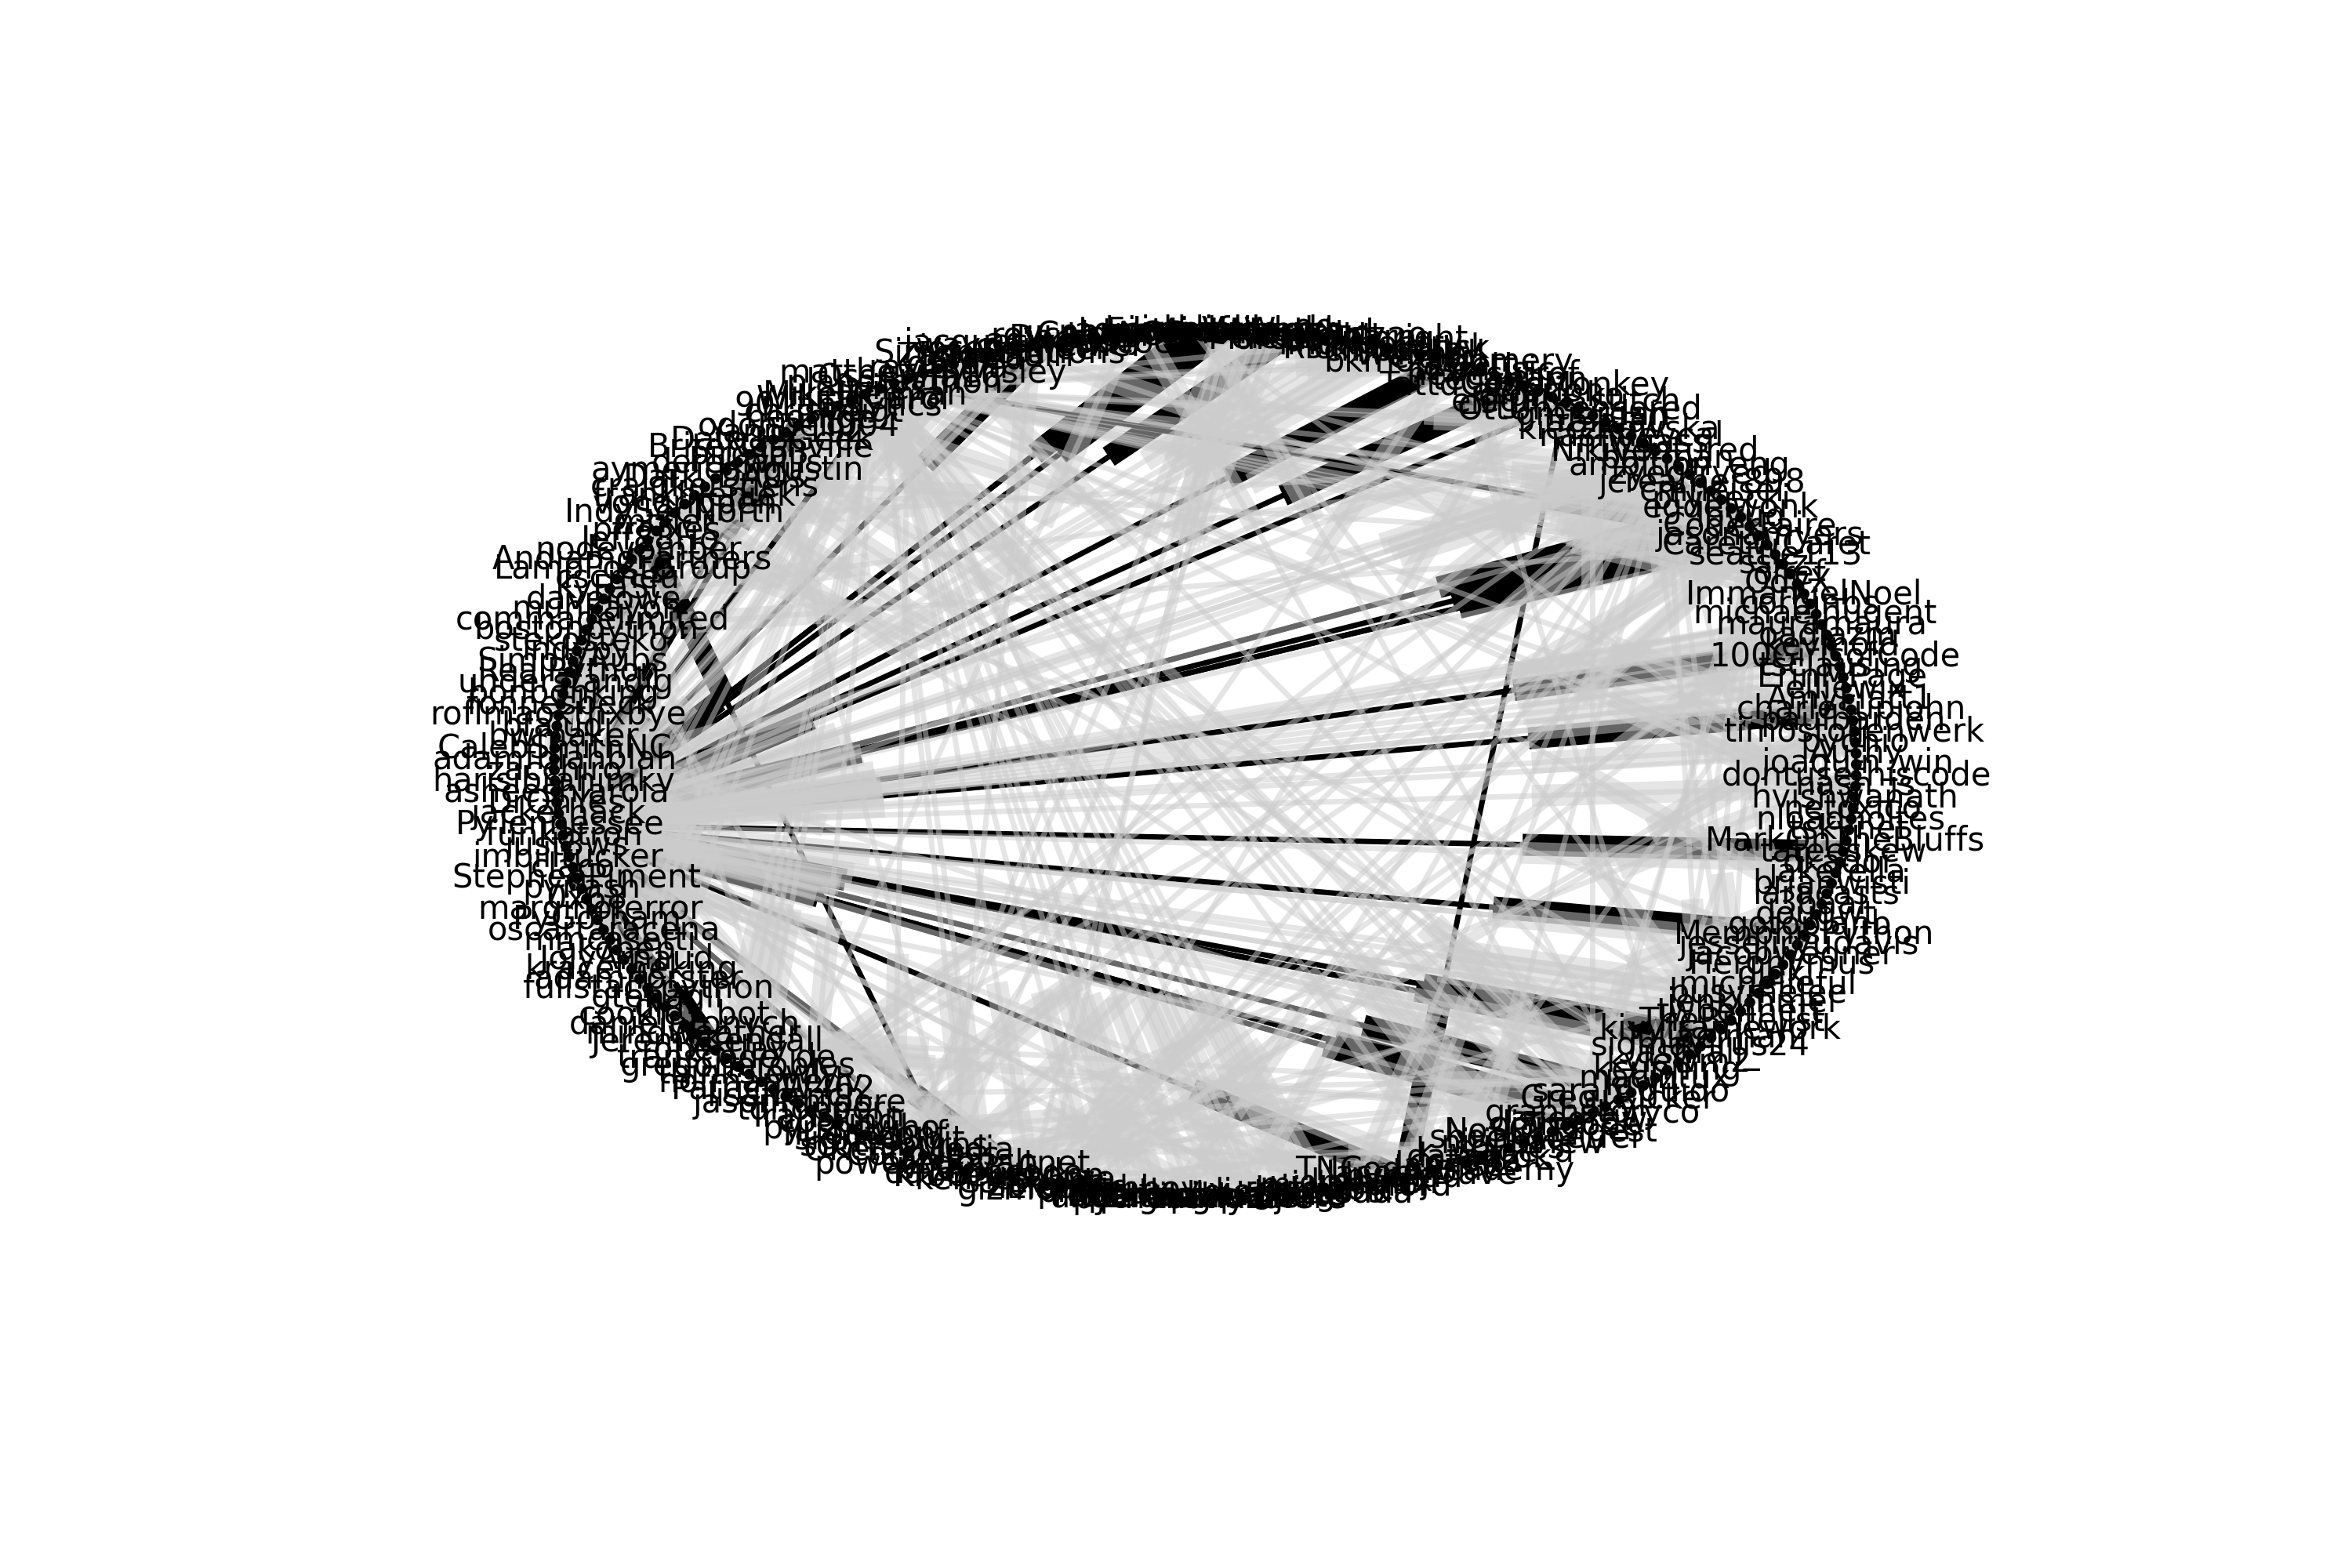 ### Fruchterman-Reingold
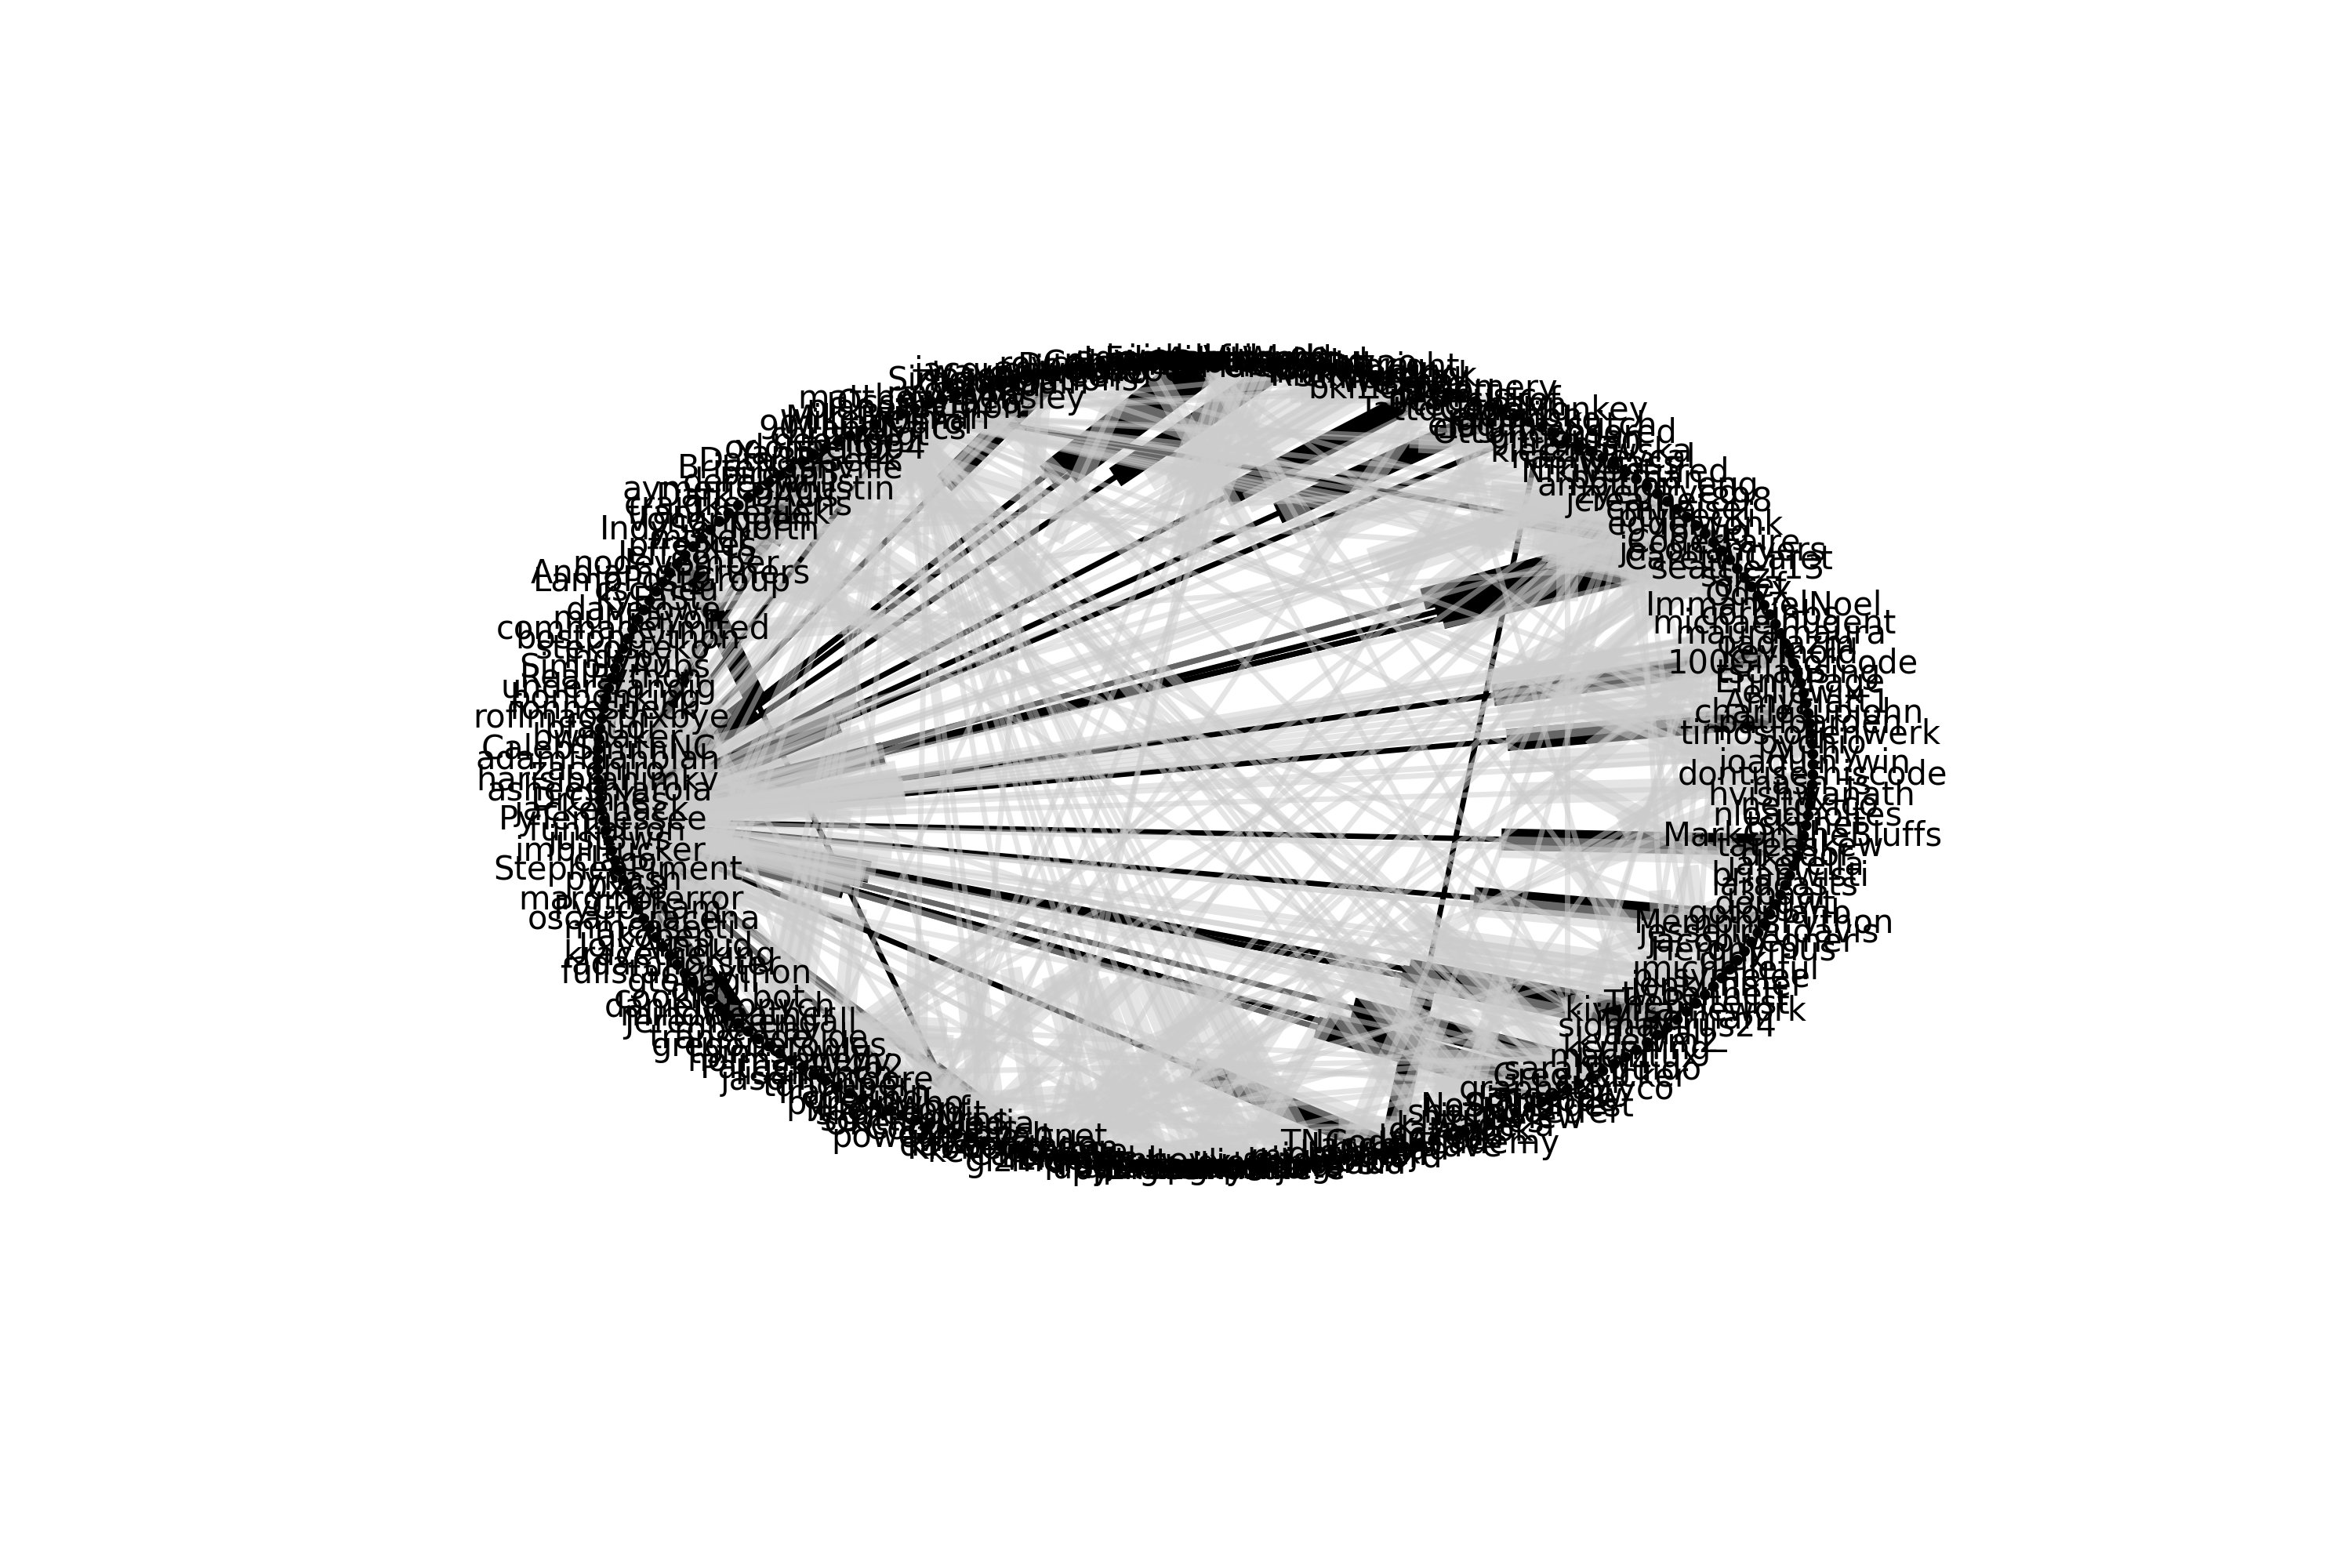
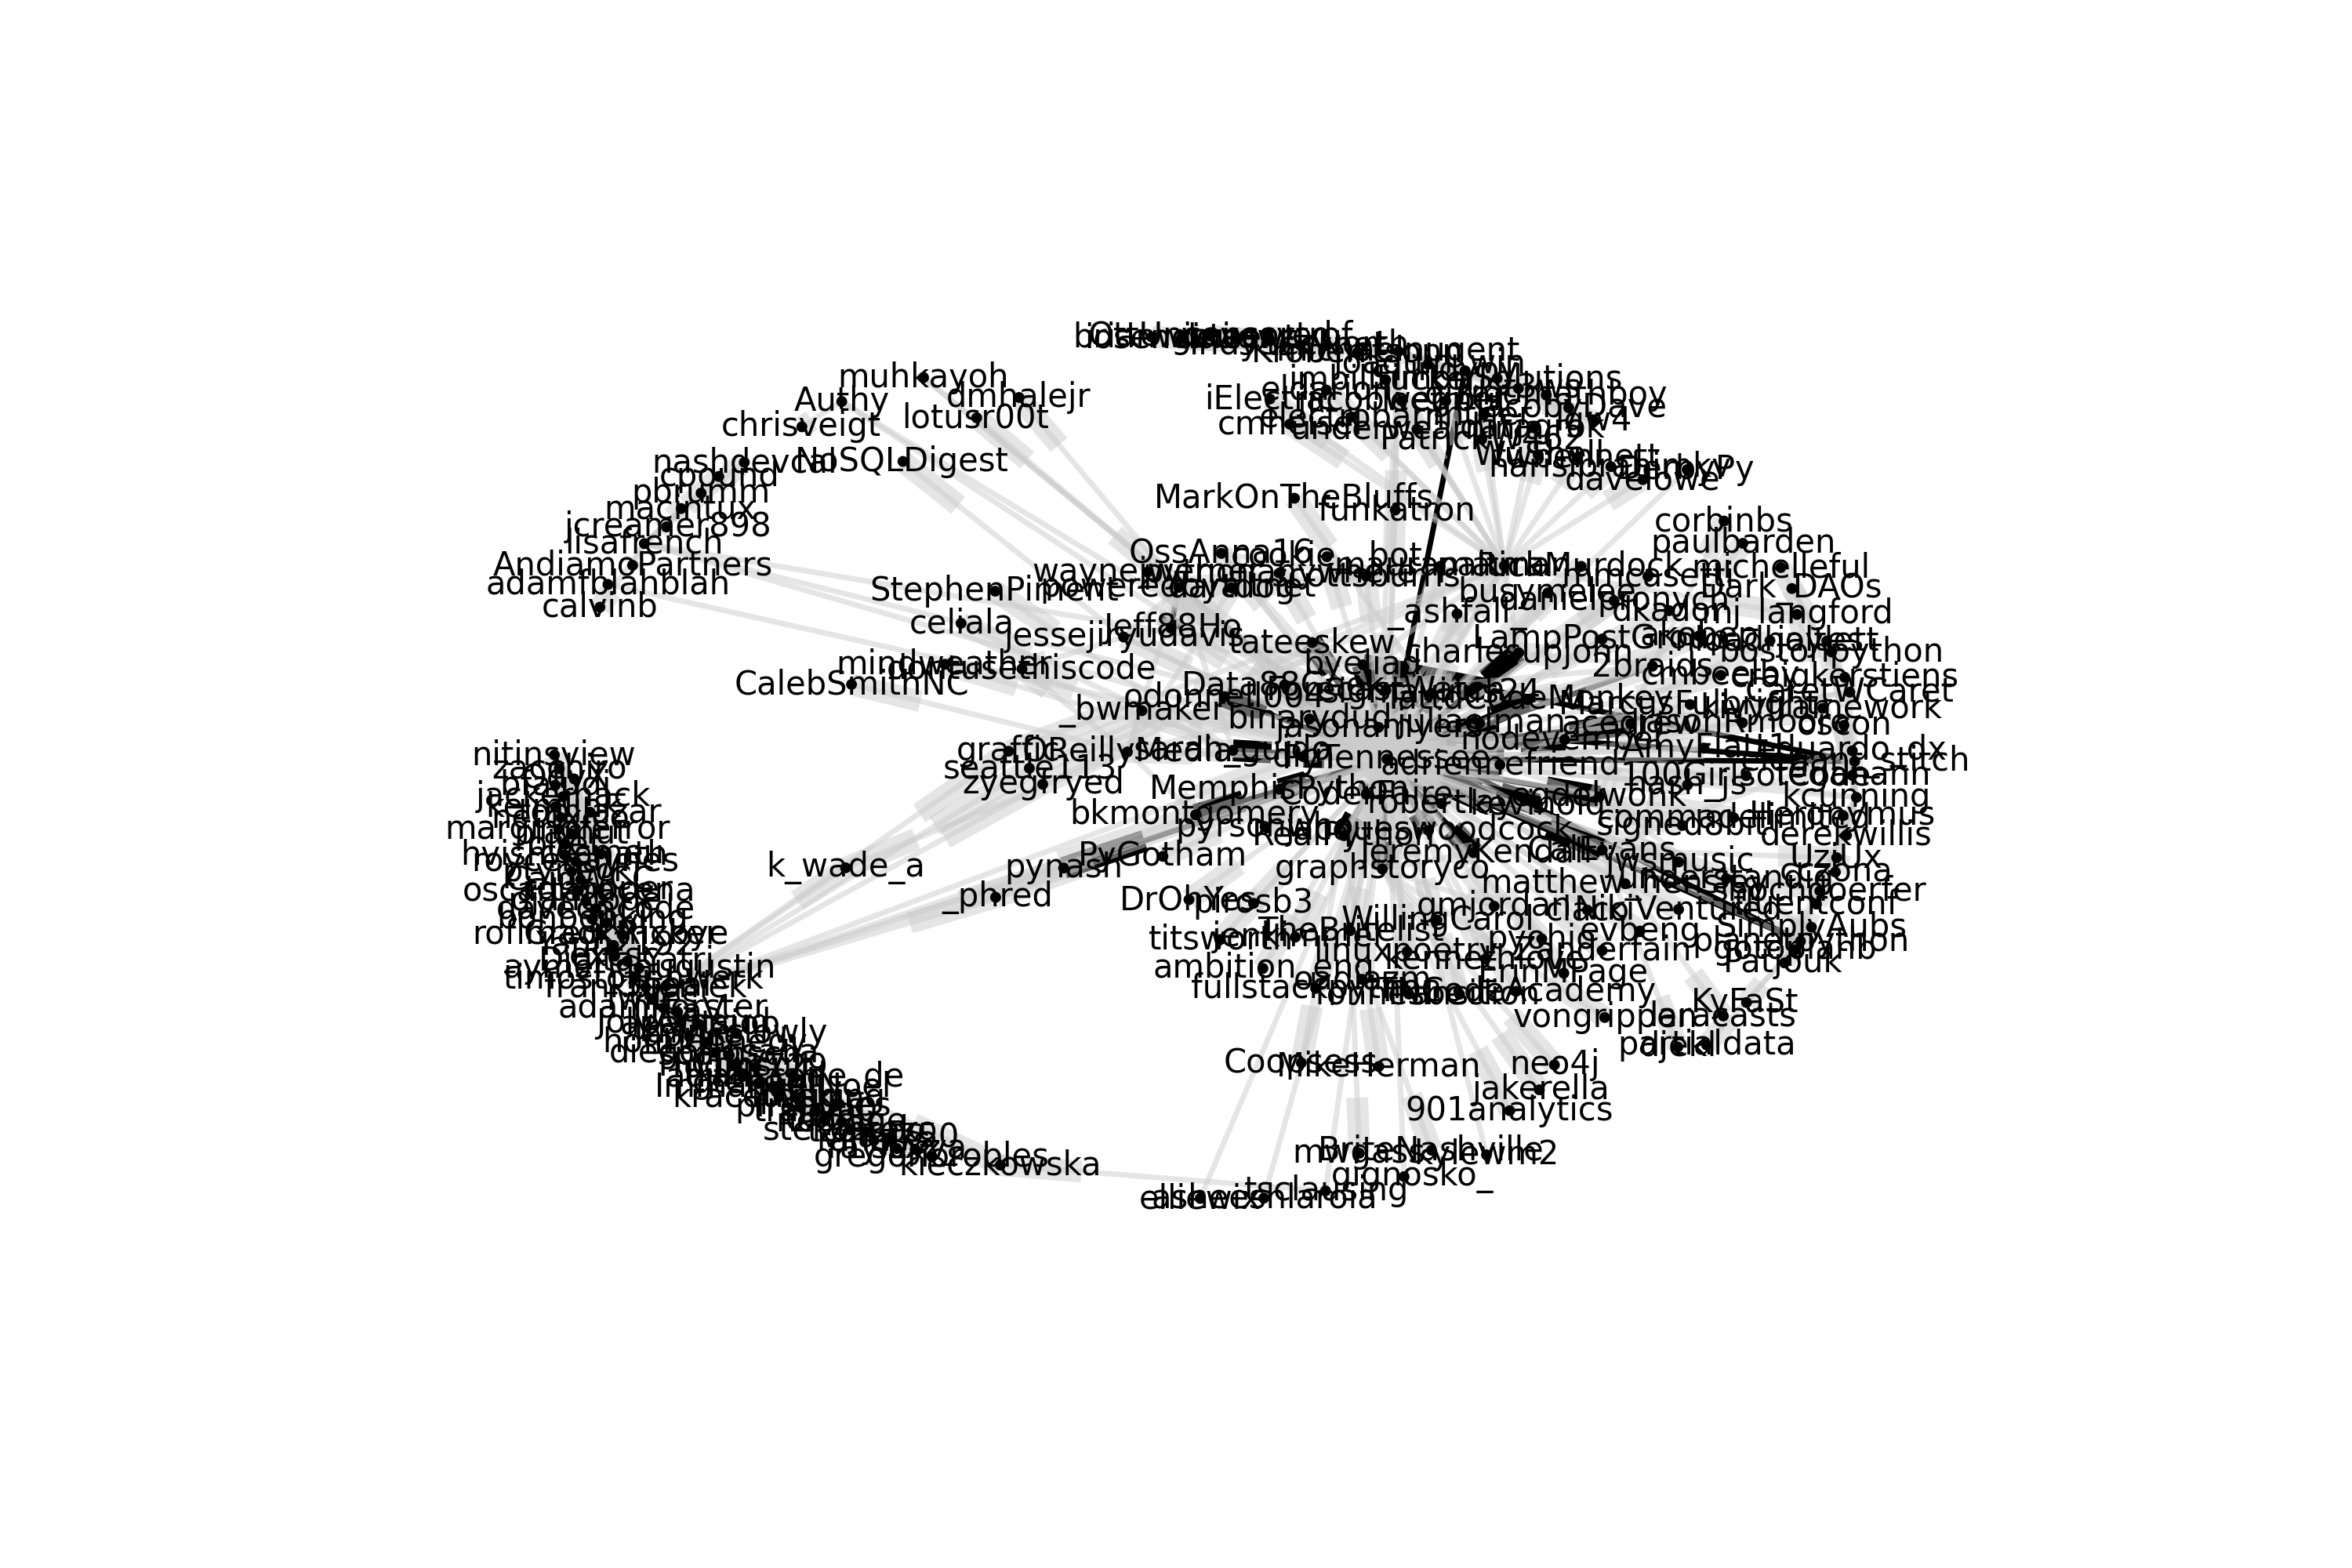 ### Random
 ### Shell
 ### Spectral