Numpy and Matplotlib
These are two of the most fundamental parts of the scientific python "ecosystem". Most everything else is built on top of them.
import numpy as np
What did we just do? We imported a package. This brings new variables (mostly functions) into our interpreter. We access them as follows.
# find out what is in our namespace
dir()
['In',
 'Out',
 '_',
 '_2',
 '_4',
 '__',
 '___',
 '__builtin__',
 '__builtins__',
 '__doc__',
 '__loader__',
 '__name__',
 '__package__',
 '__spec__',
 '_dh',
 '_i',
 '_i1',
 '_i2',
 '_i3',
 '_i4',
 '_i5',
 '_ih',
 '_ii',
 '_iii',
 '_oh',
 '_sh',
 'exit',
 'get_ipython',
 'np',
 'plt',
 'quit']
# find out what's in numpy
dir(np)
['ALLOW_THREADS',
 'BUFSIZE',
 'CLIP',
 'ComplexWarning',
 'DataSource',
 'ERR_CALL',
 'ERR_DEFAULT',
 'ERR_IGNORE',
 'ERR_LOG',
 'ERR_PRINT',
 'ERR_RAISE',
 'ERR_WARN',
 'FLOATING_POINT_SUPPORT',
 'FPE_DIVIDEBYZERO',
 'FPE_INVALID',
 'FPE_OVERFLOW',
 'FPE_UNDERFLOW',
 'False_',
 'Inf',
 'Infinity',
 'MAXDIMS',
 'MachAr',
 'ModuleDeprecationWarning',
 'NAN',
 'NINF',
 'NZERO',
 'NaN',
 'PINF',
 'PZERO',
 'PackageLoader',
 'RAISE',
 'RankWarning',
 'SHIFT_DIVIDEBYZERO',
 'SHIFT_INVALID',
 'SHIFT_OVERFLOW',
 'SHIFT_UNDERFLOW',
 'ScalarType',
 'Tester',
 'True_',
 'UFUNC_BUFSIZE_DEFAULT',
 'UFUNC_PYVALS_NAME',
 'VisibleDeprecationWarning',
 'WRAP',
 '__NUMPY_SETUP__',
 '__all__',
 '__builtins__',
 '__cached__',
 '__config__',
 '__doc__',
 '__file__',
 '__git_revision__',
 '__loader__',
 '__name__',
 '__package__',
 '__path__',
 '__spec__',
 '__version__',
 '_import_tools',
 '_mat',
 'abs',
 'absolute',
 'absolute_import',
 'add',
 'add_docstring',
 'add_newdoc',
 'add_newdoc_ufunc',
 'add_newdocs',
 'alen',
 'all',
 'allclose',
 'alltrue',
 'alterdot',
 'amax',
 'amin',
 'angle',
 'any',
 'append',
 'apply_along_axis',
 'apply_over_axes',
 'arange',
 'arccos',
 'arccosh',
 'arcsin',
 'arcsinh',
 'arctan',
 'arctan2',
 'arctanh',
 'argmax',
 'argmin',
 'argpartition',
 'argsort',
 'argwhere',
 'around',
 'array',
 'array2string',
 'array_equal',
 'array_equiv',
 'array_repr',
 'array_split',
 'array_str',
 'asanyarray',
 'asarray',
 'asarray_chkfinite',
 'ascontiguousarray',
 'asfarray',
 'asfortranarray',
 'asmatrix',
 'asscalar',
 'atleast_1d',
 'atleast_2d',
 'atleast_3d',
 'average',
 'bartlett',
 'base_repr',
 'bench',
 'binary_repr',
 'bincount',
 'bitwise_and',
 'bitwise_not',
 'bitwise_or',
 'bitwise_xor',
 'blackman',
 'bmat',
 'bool',
 'bool8',
 'bool_',
 'broadcast',
 'broadcast_arrays',
 'busday_count',
 'busday_offset',
 'busdaycalendar',
 'byte',
 'byte_bounds',
 'bytes0',
 'bytes_',
 'c_',
 'can_cast',
 'cast',
 'cdouble',
 'ceil',
 'cfloat',
 'char',
 'character',
 'chararray',
 'choose',
 'clip',
 'clongdouble',
 'clongfloat',
 'column_stack',
 'common_type',
 'compare_chararrays',
 'compat',
 'complex',
 'complex128',
 'complex256',
 'complex64',
 'complex_',
 'complexfloating',
 'compress',
 'concatenate',
 'conj',
 'conjugate',
 'convolve',
 'copy',
 'copysign',
 'copyto',
 'core',
 'corrcoef',
 'correlate',
 'cos',
 'cosh',
 'count_nonzero',
 'cov',
 'cross',
 'csingle',
 'ctypeslib',
 'cumprod',
 'cumproduct',
 'cumsum',
 'datetime64',
 'datetime_as_string',
 'datetime_data',
 'deg2rad',
 'degrees',
 'delete',
 'deprecate',
 'deprecate_with_doc',
 'diag',
 'diag_indices',
 'diag_indices_from',
 'diagflat',
 'diagonal',
 'diff',
 'digitize',
 'disp',
 'divide',
 'division',
 'dot',
 'double',
 'dsplit',
 'dstack',
 'dtype',
 'e',
 'ediff1d',
 'einsum',
 'emath',
 'empty',
 'empty_like',
 'equal',
 'errstate',
 'euler_gamma',
 'exp',
 'exp2',
 'expand_dims',
 'expm1',
 'extract',
 'eye',
 'fabs',
 'fastCopyAndTranspose',
 'fft',
 'fill_diagonal',
 'find_common_type',
 'finfo',
 'fix',
 'flatiter',
 'flatnonzero',
 'flexible',
 'fliplr',
 'flipud',
 'float',
 'float128',
 'float16',
 'float32',
 'float64',
 'float_',
 'floating',
 'floor',
 'floor_divide',
 'fmax',
 'fmin',
 'fmod',
 'format_parser',
 'frexp',
 'frombuffer',
 'fromfile',
 'fromfunction',
 'fromiter',
 'frompyfunc',
 'fromregex',
 'fromstring',
 'full',
 'full_like',
 'fv',
 'generic',
 'genfromtxt',
 'get_array_wrap',
 'get_include',
 'get_printoptions',
 'getbufsize',
 'geterr',
 'geterrcall',
 'geterrobj',
 'gradient',
 'greater',
 'greater_equal',
 'half',
 'hamming',
 'hanning',
 'histogram',
 'histogram2d',
 'histogramdd',
 'hsplit',
 'hstack',
 'hypot',
 'i0',
 'identity',
 'iinfo',
 'imag',
 'in1d',
 'index_exp',
 'indices',
 'inexact',
 'inf',
 'info',
 'infty',
 'inner',
 'insert',
 'int',
 'int0',
 'int16',
 'int32',
 'int64',
 'int8',
 'int_',
 'int_asbuffer',
 'intc',
 'integer',
 'interp',
 'intersect1d',
 'intp',
 'invert',
 'ipmt',
 'irr',
 'is_busday',
 'isclose',
 'iscomplex',
 'iscomplexobj',
 'isfinite',
 'isfortran',
 'isinf',
 'isnan',
 'isneginf',
 'isposinf',
 'isreal',
 'isrealobj',
 'isscalar',
 'issctype',
 'issubclass_',
 'issubdtype',
 'issubsctype',
 'iterable',
 'ix_',
 'kaiser',
 'kron',
 'ldexp',
 'left_shift',
 'less',
 'less_equal',
 'lexsort',
 'lib',
 'linalg',
 'linspace',
 'little_endian',
 'load',
 'loads',
 'loadtxt',
 'log',
 'log10',
 'log1p',
 'log2',
 'logaddexp',
 'logaddexp2',
 'logical_and',
 'logical_not',
 'logical_or',
 'logical_xor',
 'logspace',
 'long',
 'longcomplex',
 'longdouble',
 'longfloat',
 'longlong',
 'lookfor',
 'ma',
 'mafromtxt',
 'mask_indices',
 'mat',
 'math',
 'matrix',
 'matrixlib',
 'max',
 'maximum',
 'maximum_sctype',
 'may_share_memory',
 'mean',
 'median',
 'memmap',
 'meshgrid',
 'mgrid',
 'min',
 'min_scalar_type',
 'minimum',
 'mintypecode',
 'mirr',
 'mod',
 'modf',
 'msort',
 'multiply',
 'nan',
 'nan_to_num',
 'nanargmax',
 'nanargmin',
 'nanmax',
 'nanmean',
 'nanmedian',
 'nanmin',
 'nanpercentile',
 'nanstd',
 'nansum',
 'nanvar',
 'nbytes',
 'ndarray',
 'ndenumerate',
 'ndfromtxt',
 'ndim',
 'ndindex',
 'nditer',
 'negative',
 'nested_iters',
 'newaxis',
 'nextafter',
 'nonzero',
 'not_equal',
 'nper',
 'npv',
 'numarray',
 'number',
 'obj2sctype',
 'object',
 'object0',
 'object_',
 'ogrid',
 'oldnumeric',
 'ones',
 'ones_like',
 'outer',
 'packbits',
 'pad',
 'partition',
 'percentile',
 'pi',
 'piecewise',
 'pkgload',
 'place',
 'pmt',
 'poly',
 'poly1d',
 'polyadd',
 'polyder',
 'polydiv',
 'polyfit',
 'polyint',
 'polymul',
 'polynomial',
 'polysub',
 'polyval',
 'power',
 'ppmt',
 'print_function',
 'prod',
 'product',
 'promote_types',
 'ptp',
 'put',
 'putmask',
 'pv',
 'r_',
 'rad2deg',
 'radians',
 'random',
 'rank',
 'rate',
 'ravel',
 'ravel_multi_index',
 'real',
 'real_if_close',
 'rec',
 'recarray',
 'recfromcsv',
 'recfromtxt',
 'reciprocal',
 'record',
 'remainder',
 'repeat',
 'require',
 'reshape',
 'resize',
 'restoredot',
 'result_type',
 'right_shift',
 'rint',
 'roll',
 'rollaxis',
 'roots',
 'rot90',
 'round',
 'round_',
 'row_stack',
 's_',
 'safe_eval',
 'save',
 'savetxt',
 'savez',
 'savez_compressed',
 'sctype2char',
 'sctypeDict',
 'sctypeNA',
 'sctypes',
 'searchsorted',
 'select',
 'set_numeric_ops',
 'set_printoptions',
 'set_string_function',
 'setbufsize',
 'setdiff1d',
 'seterr',
 'seterrcall',
 'seterrobj',
 'setxor1d',
 'shape',
 'short',
 'show_config',
 'sign',
 'signbit',
 'signedinteger',
 'sin',
 'sinc',
 'single',
 'singlecomplex',
 'sinh',
 'size',
 'sometrue',
 'sort',
 'sort_complex',
 'source',
 'spacing',
 'split',
 'sqrt',
 'square',
 'squeeze',
 'std',
 'str',
 'str0',
 'str_',
 'string_',
 'subtract',
 'sum',
 'swapaxes',
 'sys',
 'take',
 'tan',
 'tanh',
 'tensordot',
 'test',
 'testing',
 'tile',
 'timedelta64',
 'trace',
 'transpose',
 'trapz',
 'tri',
 'tril',
 'tril_indices',
 'tril_indices_from',
 'trim_zeros',
 'triu',
 'triu_indices',
 'triu_indices_from',
 'true_divide',
 'trunc',
 'typeDict',
 'typeNA',
 'typecodes',
 'typename',
 'ubyte',
 'ufunc',
 'uint',
 'uint0',
 'uint16',
 'uint32',
 'uint64',
 'uint8',
 'uintc',
 'uintp',
 'ulonglong',
 'unicode',
 'unicode_',
 'union1d',
 'unique',
 'unpackbits',
 'unravel_index',
 'unsignedinteger',
 'unwrap',
 'ushort',
 'vander',
 'var',
 'vdot',
 'vectorize',
 'version',
 'void',
 'void0',
 'vsplit',
 'vstack',
 'warnings',
 'where',
 'who',
 'zeros',
 'zeros_like']
# find out what version we have
np.__version__
'1.9.2'
The numpy documentation is crucial!
http://docs.scipy.org/doc/numpy/reference/
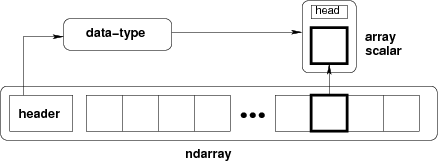
NDArrays
The core class is the numpy ndarray (n-dimensional array).
from IPython.display import Image
Image(url='http://docs.scipy.org/doc/numpy/_images/threefundamental.png')
# create an array from a list
a = np.array([9,0,2,1,0])
# find out the datatype
a.dtype
dtype('int64')
# find out the shape
a.shape
(5,)
# what is the shape
type(a.shape)
tuple
# another array with a different datatype and shape
b = np.array([[5,3,1,9],[9,2,3,0]], dtype=np.float64)
# check dtype and shape
b.dtype, b.shape
(dtype('float64'), (2, 4))
Important Concept: The fastest varying dimension is the last dimension! The outer level of the hierarchy is the first dimension. (This is called "c-style" indexing)
More array creation
There are lots of ways to create arrays.
# create some uniform arrays
c = np.zeros((9,9))
d = np.ones((3,6,3), dtype=np.complex128)
e = np.full((3,3), np.pi)
e = np.ones_like(c)
f = np.zeros_like(d)
# create some ranges
np.arange(10)
array([0, 1, 2, 3, 4, 5, 6, 7, 8, 9])
# arange is left inclusive, right exclusive
np.arange(2,4,0.25)
array([ 2. , 2.25, 2.5 , 2.75, 3. , 3.25, 3.5 , 3.75])
# linearly spaced
np.linspace(2,4,20)
array([ 2.        ,  2.10526316,  2.21052632,  2.31578947,  2.42105263,
        2.52631579,  2.63157895,  2.73684211,  2.84210526,  2.94736842,
        3.05263158,  3.15789474,  3.26315789,  3.36842105,  3.47368421,
        3.57894737,  3.68421053,  3.78947368,  3.89473684,  4.        ])
# log spaced
np.logspace(1,2,10)
array([  10.        ,   12.91549665,   16.68100537,   21.5443469 ,
         27.82559402,   35.93813664,   46.41588834,   59.94842503,
         77.42636827,  100.        ])
# two dimensional grids
x = np.linspace(-2*np.pi, 2*np.pi, 100)
y = np.linspace(-np.pi, np.pi, 50)
xx, yy = np.meshgrid(x, y)
xx.shape, yy.shape
((50, 100), (50, 100))
Indexing
Basic indexing is similar to lists
# get some individual elements of xx
xx[0,0], xx[-1,-1], xx[3,-5]
(-6.2831853071795862, 6.2831853071795862, 5.7754531611448723)
# get some whole rows and columns
xx[0].shape, xx[:,-1].shape
((100,), (50,))
# get some ranges
xx[3:10,30:40].shape
(7, 10)
There are many advanced ways to index arrays. You can read about them in the manual. Here is one example.
# use a boolean array as an index
idx = xx<0
yy[idx].shape
(2500,)
# the array got flattened
xx.ravel().shape
(5000,)
f = np.sin(xx) * np.cos(0.5*yy)
At this point you might be getting curious what these arrays "look" like. So we need to introduce some visualization.
from matplotlib import pyplot as plt
%matplotlib inline
plt.pcolormesh(f)
<matplotlib.collections.QuadMesh at 0x107995b70>

Manipulating array dimensions
# transpose
plt.pcolormesh(f.T)
<matplotlib.collections.QuadMesh at 0x107ad5128>

# reshape an array (wrong size)
g = np.reshape(f, (8,9))
---------------------------------------------------------------------------
ValueError                                Traceback (most recent call last)
<ipython-input-93-294e006fc417> in <module>()
      1 # reshape an array (wrong size)
----> 2 g = np.reshape(f, (8,9))

/Users/rpa/anaconda/envs/py34/lib/python3.4/site-packages/numpy/core/fromnumeric.py in reshape(a, newshape, order)
    219     except AttributeError:
    220         return _wrapit(a, 'reshape', newshape, order=order)
--> 221     return reshape(newshape, order=order)
    222
    223

ValueError: total size of new array must be unchanged
# reshape an array (right size) and mess it up
print(f.size)
g = np.reshape(f, (200,25))
plt.pcolormesh(g)
5000
<matplotlib.collections.QuadMesh at 0x107ca4550>

# tile an array
plt.pcolormesh(np.tile(f,(6,1)))
<matplotlib.collections.QuadMesh at 0x10826a2e8>

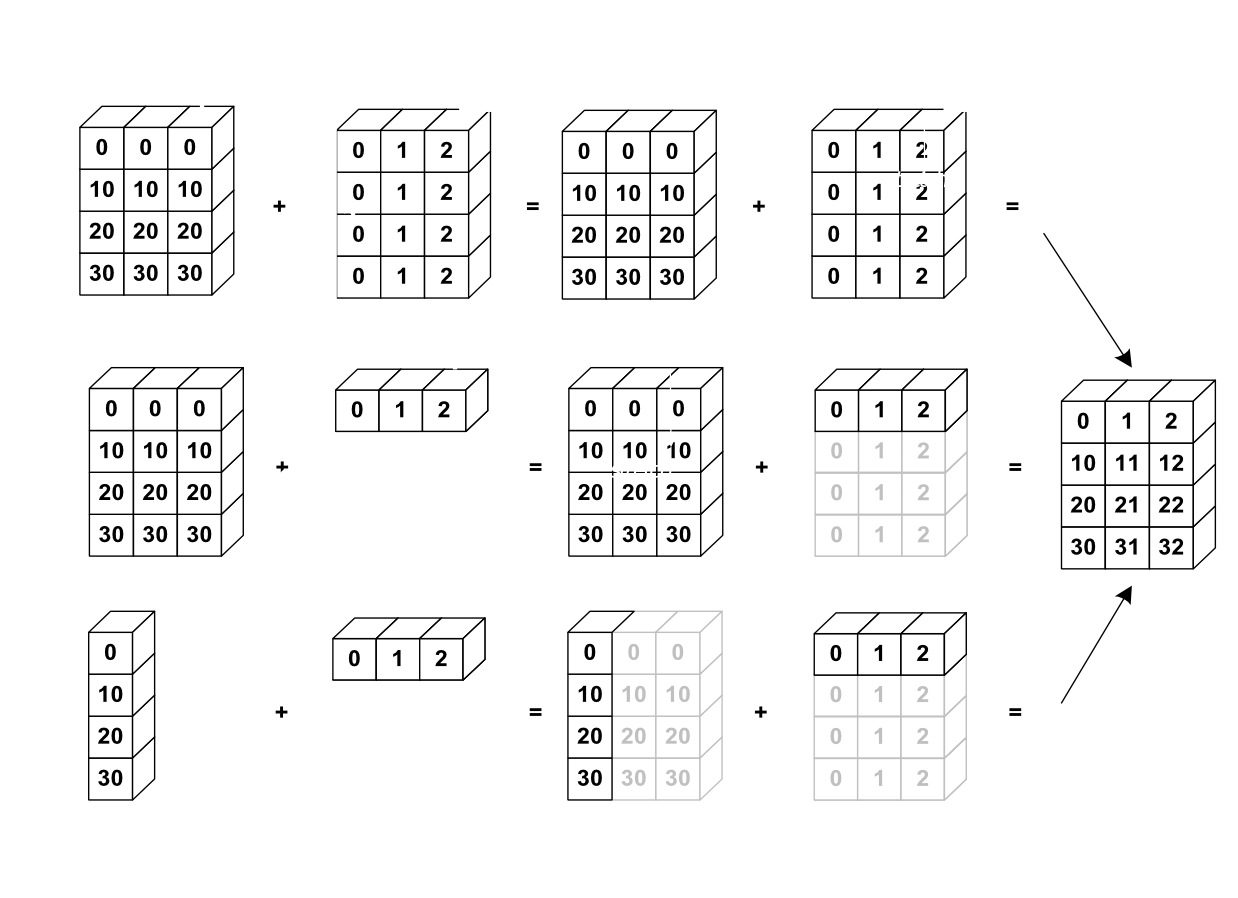
Broadcasting
Broadcasting is an efficient way to multiply arrays of different sizes
Image(url='http://scipy-lectures.github.io/_images/numpy_broadcasting.png',
     width=720)
# multiply f by x
print(f.shape, x.shape)
g = f * x
print(g.shape)
(50, 100) (100,)
(50, 100)
# multiply f by y
print(f.shape, y.shape)
h = f * y
print(h.shape)
(50, 100) (50,)
---------------------------------------------------------------------------
ValueError                                Traceback (most recent call last)
<ipython-input-104-79198d42b1dc> in <module>()
      1 # multiply f by y
      2 print(f.shape, y.shape)
----> 3 h = f * y
      4 print(h.shape)

ValueError: operands could not be broadcast together with shapes (50,100) (50,)
# use newaxis special syntax
h = f * y[:,np.newaxis]
print(h.shape)
(50, 100)
plt.pcolormesh(g)
<matplotlib.collections.QuadMesh at 0x108d5d668>

Reduction Operations
# sum
g.sum()
-3083.0383878071548
# mean
g.mean()
-0.61660767756143098
# std
g.std()
1.6402280119141424
# apply on just one axis
g_ymean = g.mean(axis=0)
g_xmean = g.mean(axis=1)
plt.plot(x, g_ymean)
[<matplotlib.lines.Line2D at 0x108f82fd0>]

plt.plot(g_xmean, y)
[<matplotlib.lines.Line2D at 0x109225e10>]

Fancy Plotting
Enough lessons, let's have some fun.
fig = plt.figure(figsize=(12,8))
ax1 = plt.subplot2grid((6,6),(0,1),colspan=5)
ax2 = plt.subplot2grid((6,6),(1,0),rowspan=5)

fig = plt.figure(figsize=(10,6))
ax1 = plt.subplot2grid((6,6),(0,1),colspan=5)
ax2 = plt.subplot2grid((6,6),(1,0),rowspan=5)
ax3 = plt.subplot2grid((6,6),(1,1),rowspan=5, colspan=5)

ax1.plot(x, g_ymean)
ax2.plot(g_xmean, y)
ax3.pcolormesh(x, y,  g)

ax1.set_xlim([x.min(), x.max()])
ax3.set_xlim([x.min(), x.max()])
ax2.set_ylim([y.min(), y.max()])
ax3.set_ylim([y.min(), y.max()])

plt.tight_layout()

Real Data
ARGO float profile from North Atlantic
# download with curl
!curl -O http://www.ldeo.columbia.edu/~rpa/argo_float_4901412.npz
  % Total    % Received % Xferd  Average Speed   Time    Time     Time  Current
                                 Dload  Upload   Total   Spent    Left  Speed
100  140k  100  140k    0     0  1468k      0 --:--:-- --:--:-- --:--:-- 1480k
# load numpy file and examine keys
data = np.load('argo_float_4901412.npz')
data.keys()
['S', 'T', 'levels', 'lon', 'date', 'P', 'lat']
# access some data
T = data['T']
# there are "nans", missing data, which screw up our routines
T.min()
nan
Masked Arrays
This is how we deal with missing data in numpy
# create masked array
T = np.ma.masked_invalid(data['T'])
type(T)
numpy.ma.core.MaskedArray
# max and min
T.max(), T.min()
(24.364999771118164, 3.5320000648498535)
# load other data
S = np.ma.masked_invalid(data['S'])
P = np.ma.masked_invalid(data['P'])
# scatter plot
plt.scatter(S, T, c=P)
plt.grid()
plt.colorbar()
<matplotlib.colorbar.Colorbar at 0x10a385908>

Individual Exercise
- Calculate and plot the depth mean profile of T, S and P with error bars to indicate the standard deviation.
- Calculate the timeseries of the depth-averaged profiles of T, S, and P