UN Population Division Data API
This notebook describes a simple pandas API for downloading data from the UN Department of Social and Economic Affairs Population Division on-line database.
Data relating to population distributions can be found on the United Nation’s Department of Population and Economic Affairs Population Division http://esa.un.org/unpd/wpp/unpp/panel_indicators.htm From the Online Database area select Detailed Indicators in the navigation bar on the left-hand side of the page, then choose Population by five-year age group and sex to get the data.
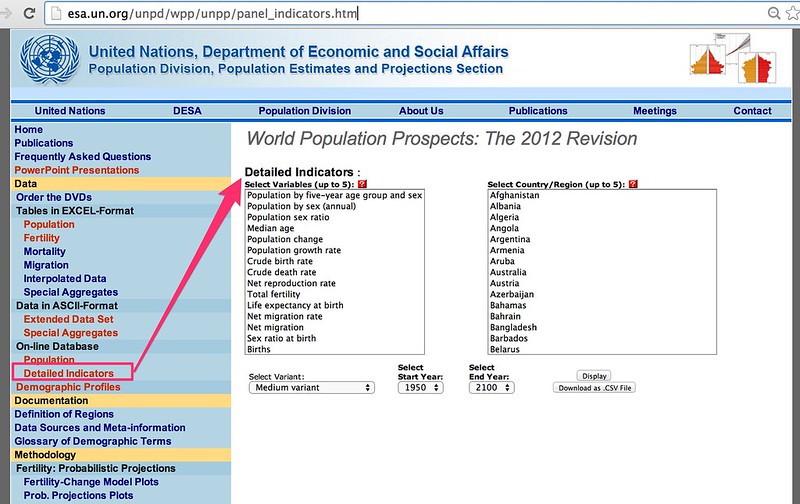
The current site allows you to select up to 5 indicators and 5 countries, as well as selecting start and end dates. The data can then be displayed in a table in a web page or downloaded as a CSV file.
This notebook implements a simple downloading routine that allows you to specify up to five countries and up to five indicators and retrieve the data in the form of a pandas dataframe.
A scraper is also provided that captures the allowable options from the indicator list and the country list, as well as the indicator variant. These options can be searched using case insensitive partial string matching.
#If you do not have BeautifulSoup installed already, you will need to install it
#!pip3 install beautifulsoup4
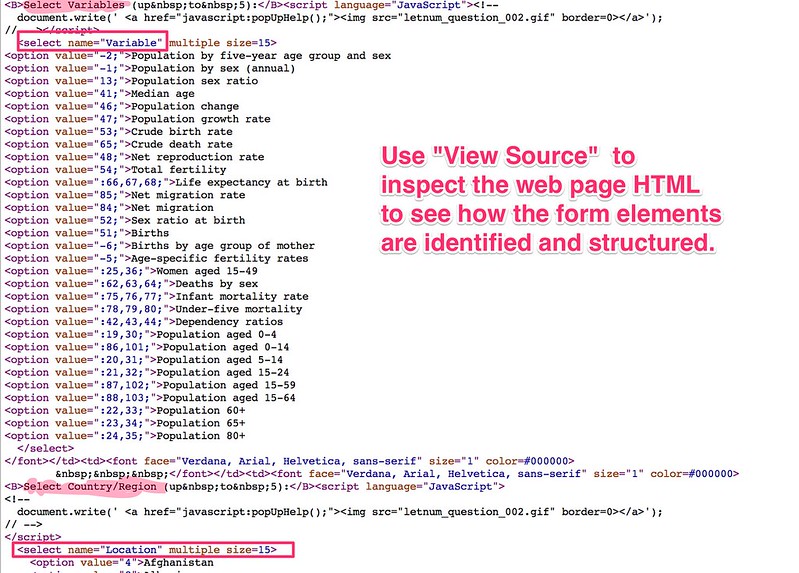
If we View Source on the web page we can see which form elements contain the variable, country and variant lists:
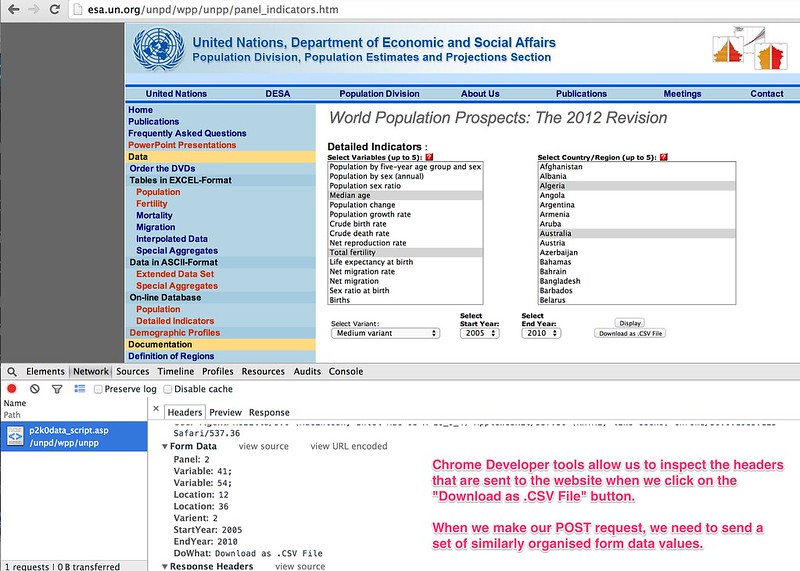
We can also inspect the details of the elements that are passed to to the server when a download request is made.
#Routines for scraping and downloading data from http://esa.un.org/unpd/wpp/unpp/panel_indicators.htm

import requests
from bs4 import BeautifulSoup

#I'm in a Python3 environment
from io import StringIO
import pandas as pd

def getFormSelectVals(soup,name):
    ''' Parse out options from an HTML select list '''

    tmp={}
    items=soup.find('select',{'name':name})
    for o in items.findAll('option'):
        #print(o.attrs['value'],o.text.strip())
        tmp[o.text.strip()]=o.attrs['value']
    return tmp


def getUNPopDivIndicators():
    ''' Grab the UN Population Division indicators page and parse out form values '''

    url='http://esa.un.org/unpd/wpp/unpp/panel_indicators.htm'
    page = requests.get(url)

    soup=BeautifulSoup(page.content)

    unpop={}
    unpop['vars']=getFormSelectVals(soup,'Variable')
    unpop['countries']=getFormSelectVals(soup,'Location')
    unpop['variants']=getFormSelectVals(soup,'Varient')

    return unpop


def getUNPopDivData(dfi,country,indicator,variant='Medium variant',startyear=1950,endyear=2010):
    ''' Download selected data from the UN Population Division indicators page and return it as a pandas dataframe '''

    if not isinstance(country,list): country= [country]
    if not isinstance(indicator,list): indicator= [indicator]

    #Limited to five options - use the first 5
    #For each item, look up the name from the scraped form elements and find what code number to use.
    locations= [dfi['countries'][x] for x in country[:5]]
    variables= [dfi['vars'][x] for x in indicator[:5]]

    varient=dfi['variants'][variant]

    data=[('Panel',2),('Varient',varient),('StartYear',startyear),('EndYear',endyear),('DoWhat','Download as .CSV File')]

    #If we request multiple locations or variables, the form repeats the 'Location' or 'Variable' attribute name
    #This means we can't use a Python dict to represent the arguments - instead we create a list of tuples
    for l in locations: data.append(('Location',l))
    for v in variables: data.append(('Variable',v))

    url='http://esa.un.org/unpd/wpp/unpp/p2k0data_script.asp'

    response = requests.post(url,data=data)

    #The data is returned as a string - we use StringIO to make it look like a file stream so pd.read_csv() can read it
    #The last two lines of the returned data are an empty line and a metadata line - so let's ignore them.
    #skipfooter currently only works with the python engine - so let's declare that to prevent a warning
    df=pd.read_csv(StringIO(response.text), skipfooter=2, engine='python' )

    return df
#Helper routines for working with the data
def search(d, substr):
    ''' Partial string match search within dict key names '''
    #via http://stackoverflow.com/a/10796050/454773

    result = []
    for key in d:
        if substr.lower() in key.lower():
            result.append((key, d[key]))

    return result
So that's the code... now how do we use it?
The first thing we need to do is see what indicators are available:
#Get indicators
dfi=getUNPopDivIndicators()

#Preview indicators
dfi['vars']
{'Median age': '41;',
 'Deaths by sex': ':62,63,64;',
 'Population change': '46;',
 'Under-five mortality': ':78,79,80;',
 'Sex ratio at birth': '52;',
 'Net migration rate': '85;',
 'Population sex ratio': '13;',
 'Population aged 0-4': ':19,30;',
 'Dependency ratios': ':42,43,44;',
 'Net reproduction rate': '48;',
 'Population aged 15-24': ':21,32;',
 'Population by sex (annual)': '-1;',
 'Population by five-year age group and sex': '-2;',
 'Infant mortality rate': ':75,76,77;',
 'Births by age group of mother': '-6;',
 'Births': '51;',
 'Total fertility': '54;',
 'Population 80+': ':24,35;',
 'Crude birth rate': '53;',
 'Age-specific fertility rates': '-5;',
 'Life expectancy at birth': ':66,67,68;',
 'Population 65+': ':23,34;',
 'Population aged 15-64': ':88,103;',
 'Crude death rate': '65;',
 'Population growth rate': '47;',
 'Net migration': '84;',
 'Population aged 15-59': ':87,102;',
 'Population 60+': ':22,33;',
 'Population aged 0-14': ':86,101;',
 'Women aged 15-49': ':25,36;',
 'Population aged 5-14': ':20,31;'}
We can also search within indicators to find their proper names.
#Example search within indicators
search(dfi['vars'],'pop')
[('Population change', '46;'),
 ('Population sex ratio', '13;'),
 ('Population aged 0-4', ':19,30;'),
 ('Population aged 15-24', ':21,32;'),
 ('Population by sex (annual)', '-1;'),
 ('Population by five-year age group and sex', '-2;'),
 ('Population 80+', ':24,35;'),
 ('Population 65+', ':23,34;'),
 ('Population aged 15-64', ':88,103;'),
 ('Population growth rate', '47;'),
 ('Population aged 15-59', ':87,102;'),
 ('Population 60+', ':22,33;'),
 ('Population aged 0-14', ':86,101;'),
 ('Population aged 5-14', ':20,31;')]
The following shows us what prediction variants are supported.
#Show variants of predictions
dfi['variants']
{'Low variant': '4',
 'Constant-fertility variant': '5',
 'High variant': '3',
 'Medium variant': '2'}
We search for countries by name - but we need to make sure we pass the name in correctly. So search to find out...
#Example search within country names
search(dfi['countries'],'united')
[('United States of America', '840'),
 ('United Arab Emirates', '784'),
 ('United Republic of Tanzania', '834'),
 ('United States Virgin Islands', '850'),
 ('United Kingdom', '826')]
Once we know what we want to ask for, we can make a data request.
#Let's run a test query
ukpop=getUNPopDivData(dfi,['United Kingdom','Bangladesh','India','France','Germany','Italy'],
                      ['Population 80+','Population sex ratio'],startyear=2000,endyear=2000)
#Show unique countries - only data for the first five should have been requested
ukpop['Country'].unique()
array(['United Kingdom', 'Bangladesh', 'India', 'France', 'Germany'], dtype=object)
#Preview the dataframe
ukpop
| Country | Variable | Variant | Year | Value | |
|---|---|---|---|---|---|
| 0 | United Kingdom | Population aged 80 or over (thousands) | Medium variant | 2000 | 2361.0 |
| 1 | United Kingdom | Percentage aged 80 or over (%) | Medium variant | 2000 | 4.0 |
| 2 | Bangladesh | Population aged 80 or over (thousands) | Medium variant | 2000 | 788.0 |
| 3 | Bangladesh | Percentage aged 80 or over (%) | Medium variant | 2000 | 0.6 |
| 4 | India | Population aged 80 or over (thousands) | Medium variant | 2000 | 5686.0 |
| 5 | India | Percentage aged 80 or over (%) | Medium variant | 2000 | 0.5 |
| 6 | France | Population aged 80 or over (thousands) | Medium variant | 2000 | 2190.0 |
| 7 | France | Percentage aged 80 or over (%) | Medium variant | 2000 | 3.7 |
| 8 | Germany | Population aged 80 or over (thousands) | Medium variant | 2000 | 2882.0 |
| 9 | Germany | Percentage aged 80 or over (%) | Medium variant | 2000 | 3.5 |
| 10 | United Kingdom | Population sex ratio (males per 100 females) | Medium variant | 2000 | 95.0 |
| 11 | Bangladesh | Population sex ratio (males per 100 females) | Medium variant | 2000 | 106.6 |
| 12 | India | Population sex ratio (males per 100 females) | Medium variant | 2000 | 107.6 |
| 13 | France | Population sex ratio (males per 100 females) | Medium variant | 2000 | 93.9 |
| 14 | Germany | Population sex ratio (males per 100 females) | Medium variant | 2000 | 95.2 |
#Processors for pyramid chart
def processWorldPopData(dfi,fname,countries=[],start=1950,end=2010):
    df=getUNPopDivData(dfi,countries,
                       ['Population by five-year age group and sex'],
                       startyear=start,
                       endyear=end)
    dfp=df[['Year','Age','Sex','Value']]
    dfp=dfp[dfp['Sex']!='Total']
    dfp['Age']=dfp['Age'].apply(lambda x: x.replace('+','-').split('-')[0])
    dfp['Sex']=dfp['Sex'].map( {'Male':1,'Female':2} )
    dfp.columns=['year','age','sex','people']
    dfp.to_csv(fname,index=False)

processWorldPopData(dfi,'delme',['Bahrain'])
!head delme
year,age,sex,people
1950, 0,1,10
1950, 0,2,10
1950, 5,1,8
1950, 5,2,8
1950, 10,1,7
1950, 10,2,6
1950, 15,1,6
1950, 15,2,5
1950, 20,1,6
Summary
This notebook has described a set of routines for requesting and downloading data from the UN Department of Social and Economic Affairs Population Division on-line database and returning it as a pandas dataframe.
A similar approach can be followed for the retrieval of data files published on other sites.