Reshaping data with stack and unstack
%matplotlib inline
import pandas as pd
import numpy as np
import matplotlib.pyplot as plt
try:
    import seaborn
except ImportError:
    pass

pd.options.display.max_rows = 8
Case study: air quality data of European monitoring stations (AirBase)
Going further with the time series case study [test](05 - Time series data.ipynb) on the AirBase (The European Air quality dataBase) data: the actual data downloaded from the Airbase website did not look like a nice csv file (data/airbase_data.csv).
One of the actual downloaded raw data files of AirBase is included in the repo:
!head -1 ./data/BETR8010000800100hour.1-1-1990.31-12-2012
Just reading the tab-delimited data:
data = pd.read_csv("data/BETR8010000800100hour.1-1-1990.31-12-2012", sep='\t')#, header=None)
data.head()
The above data is clearly not ready to be used! Each row contains the 24 measurements for each hour of the day, and also contains a flag (0/1) indicating the quality of the data.
- specify that the values of -999 and -9999 should be regarded as NaN
- specify are own column names (http://stackoverflow.com/questions/6356041/python-intertwining-two-lists)
hours = ["{:02d}".format(i) for i in range(24)]
# %load snippets/06 - Reshaping data6.py
# %load snippets/06 - Reshaping data7.py
For now, we disregard the 'flag' columns
# %load snippets/06 - Reshaping data8.py
Now, we want to reshape it: our goal is to have the different hours as row indices, merged with the date into a datetime-index.
Overview: reshaping your data with stack, unstack and pivot
The docs say:
Pivot a level of the (possibly hierarchical) column labels, returning a
DataFrame (or Series in the case of an object with a single level of column labels) having a hierarchical index with a new inner-most level of row labels.
df = pd.DataFrame({'A':['one', 'one', 'two', 'two'], 'B':['a', 'b', 'a', 'b'], 'C':range(4)})
df
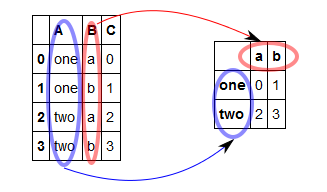
To use stack/unstack, we need the values we want to shift from rows to columns or the other way around as the index:
df = df.set_index(['A', 'B'])
df
result = df['C'].unstack()
result
df = result.stack().reset_index(name='C')
df
pivot is similar to unstack, but let you specify column names:
df.pivot(index='A', columns='B', values='C')
pivot_table is similar as pivot, but can work with duplicate indices and let you specify an aggregation function:
df = pd.DataFrame({'A':['one', 'one', 'two', 'two', 'one', 'two'], 'B':['a', 'b', 'a', 'b', 'a', 'b'], 'C':range(6)})
df
df.pivot_table(index='A', columns='B', values='C', aggfunc='count') #'mean'
Back to our case study
We can now use stack and some other functions to create a timeseries from the original dataframe:
colnames = ['date'] + [item for pair in zip(["{:02d}".format(i) for i in range(24)], ['flag']*24) for item in pair]

data = pd.read_csv("data/BETR8010000800100hour.1-1-1990.31-12-2012",
                   sep='\t', header=None, na_values=[-999, -9999], names=colnames)
data = data.drop('flag', axis=1)
data.head()
The end result should look like:
| BETR801 | |
|---|---|
| 1990-01-02 09:00:00 | 48.0 |
| 1990-01-02 12:00:00 | 48.0 |
| 1990-01-02 13:00:00 | 50.0 |
| 1990-01-02 14:00:00 | 55.0 |
| ... | ... |
| 2012-12-31 20:00:00 | 16.5 |
| 2012-12-31 21:00:00 | 14.5 |
| 2012-12-31 22:00:00 | 16.5 |
| 2012-12-31 23:00:00 | 15.0 |
170794 rows × 1 columns
First, reshape the dataframe so that each row consists of one observation for one date + hour combination:
# %load snippets/06 - Reshaping data18.py
# %load snippets/06 - Reshaping data19.py
# %load snippets/06 - Reshaping data20.py
Now, combine the date and hour colums into a datetime (tip: string columns can be summed to concatenate the strings):
# %load snippets/06 - Reshaping data21.py
# %load snippets/06 - Reshaping data22.py
# %load snippets/06 - Reshaping data23.py
# %load snippets/06 - Reshaping data24.py
# %load snippets/06 - Reshaping data25.py
# use the data of above
data = data_stacked
# or read from the processed csv file
#data = pd.read_csv('data/airbase_data.csv', index_col=0, parse_dates=True, na_values=[-9999])[['BETR801']]
#data = data['1999':]
data.index.weekday?
# %load snippets/06 - Reshaping data28.py
Add a column indicating week/weekend
# %load snippets/06 - Reshaping data29.py
# %load snippets/06 - Reshaping data30.py
# %load snippets/06 - Reshaping data31.py
# %load snippets/06 - Reshaping data32.py
# %load snippets/06 - Reshaping data33.py
Tip: the boxplot method of a DataFrame expects the data for the different boxes in different columns). For this, you can either use pivot_table as a combination of groupby and unstack
# %load snippets/06 - Reshaping data34.py
# %load snippets/06 - Reshaping data35.py
# %load snippets/06 - Reshaping data36.py
An alternative method using groupby and unstack:
# %load snippets/06 - Reshaping data37.py
We can also use the reshaping methods with the movie data
cast = pd.read_csv('data/cast.csv')
cast.head()
titles = pd.read_csv('data/titles.csv')
titles.head()
# %load snippets/06 - Reshaping data40.py
# %load snippets/06 - Reshaping data41.py
# %load snippets/06 - Reshaping data42.py
# %load snippets/06 - Reshaping data43.py