Visualizing the Grand Tack Scenerio in Uniview
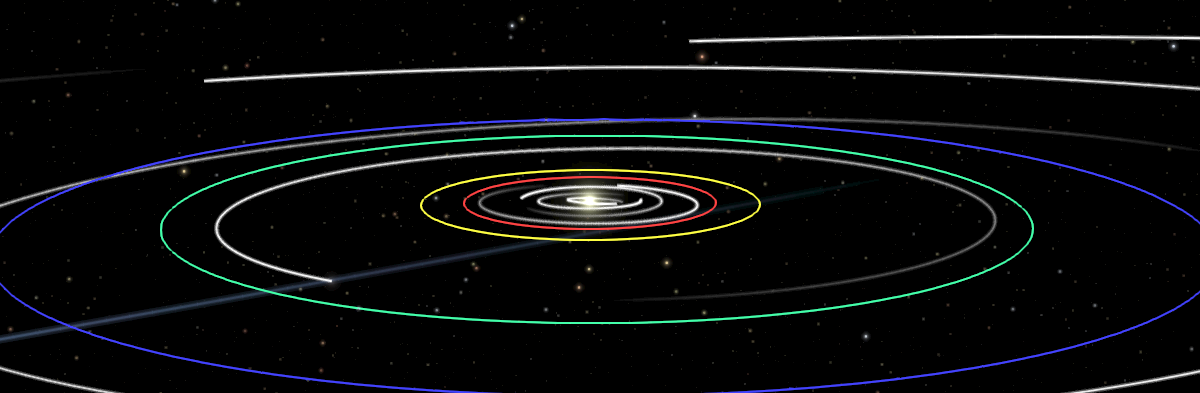
The Grand Tack Scenerio is a model for planetary migration in the early solar system that was published by Walsh et. al in 2011 in Nature. In this model Jupiter migrates all the way inward to 1.5 AU (Mars' current orbit), Saturn migrates in later, gets caught in a 3:2 resonance with Jupiter and then both planets migrate back out.
This model explains a numbers of longstanding questions such as the low mass of Mars, and why the Asteroid belt contains both rocky and icy objects.
Acquire Data
The data was captured from figure 1. of the Nature paper:
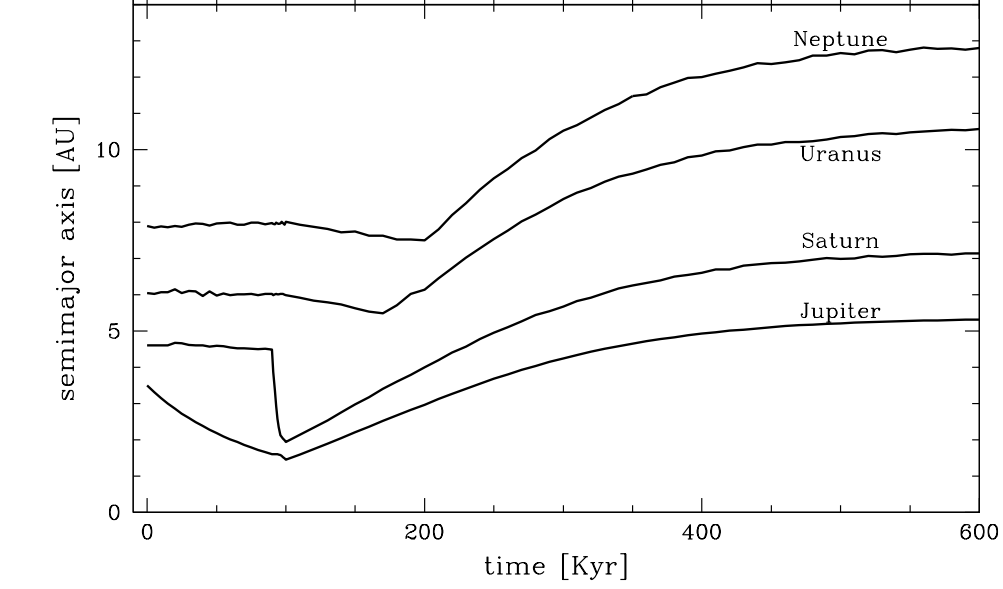 Data for each of the four lines was captured using WebPlotDigitizer and saved as a csv file.
Process Data
The following python code converts the four csv files into a single USES style data file. Each line contains the beginning and ending values for semimajor radius as well as the time. A fifth value indicates the planet and the last four values are unused.
Initalize parameters and open file for writing
tvals=[0]
avals=[0]
platform=0.1#define length of tme to hold visualization before first and after last frame
writeFile=open("GrandTack\GrandTack.raw",'w')
Subroutine to read capture data file for a planet and append to a USES style output file
#Read data file
def processDataCapture(fileName,planetNo):
    file = open(fileName,'r')
    for line in file:
        elements=line.split(',')
        tvals.append(float(elements[0])/1000000.)
        avals.append(float(elements[1]))
    tvals[0]=tvals[1]-platform
    avals[0]=avals[1]
    tvals.append(tvals[len(tvals)-1]+platform)
    avals.append(avals[len(avals)-1])
    for i in range(len(tvals)-1):
        deltaT = (tvals[i]-tvals[i+1])
        outstr = "{0:8.6f} {1:8.6f} {2:9.7f} {3:9.7f} {4} 1 2 3 4\n".format(avals[i],avals[i+1],tvals[i],deltaT,planetNo)
        writeFile.write(outstr)
Process data files for Jupiter, Saturn, Uranus and Neptune
processDataCapture("GrandTackData\Jupiter.csv",5)
processDataCapture("GrandTackData\Saturn.csv",6)
processDataCapture("GrandTackData\Uranus.csv",7)
processDataCapture("GrandTackData\Neptune.csv",8)
writeFile.close()
Graphics Shaders
The geometry shader does the work here. Each geometry element contains the starting and ending point for the planet's semimajor radius. If the time falls within the timestep a circular orbit line is drawn at the interpolated radius (with color given by the planet).