%pylab inline
rcParams['figure.figsize'] = (10, 4) #wide graphs by default
from __future__ import print_function
from __future__ import division
Populating the interactive namespace from numpy and matplotlib
Convolution:
$$(f * g )(\tau) \stackrel{\mathrm{def}}{=}\ \int_{-\infty}^\infty f(t)\, g(\tau - t)\, d\tau$$Doesn't this look a lot like cross-correlation?
$$(f \star g)(t)\ \stackrel{\mathrm{def}}{=} \int_{-\infty}^{\infty} f^*(\tau)\ g(t+\tau)\,d\tau$$Discrete Convolution:
$$(f * g)[n]\ \stackrel{\mathrm{def}}{=}\ \sum_{m=-\infty}^\infty f[m]\, g[n - m]$$Circular discrete convolution:
$$(f * g_N)[n] = \sum_{m=0}^{N-1} f[m]\ g_N[n-m]$$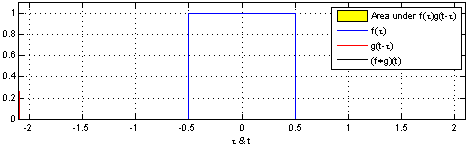

Discrete Convolution can be understood as placing a copy of the Impulse Response (one of the source signals) at every sample of the other, scaled by it. IOW treat each sample as an impulse that "activates" the response.
impulse = r_[1,zeros(15)]
stem(arange(16),impulse)
xlim((-0.5, 16))
ylim((-1.1, 1.1))
(-1.1, 1.1)

Now make an impulse response:
ir = 2*(random.random(3) -0.5)

stem(arange(3),ir)

xlim((-0.5, 2.5))
ylim((-1.1, 1.1))
(-1.1, 1.1)

Convolving an impulse with the response:
stem(arange(18),convolve(impulse, ir))
xlim(-1,18)
(-1, 18)

When we convolve an impulse, the response is copied at the time and amplitude of it:
impulse2 = r_[zeros(5), -1, zeros(10)]
stem(arange(16),impulse2)
xlim((-0.5, 16))
ylim((-1.1, 1.1))
(-1.1, 1.1)

stem(arange(18),convolve(impulse2, ir));

Because the process is linear and the superposition principle applies (we can superimpose the result instead of superimposing the input with the same result):
subplot(121)
added_after = convolve(impulse, ir) + convolve(impulse2, ir)
stem(arange(18),added_after)

added_before = convolve(impulse + impulse2, ir)
subplot(122)
stem(arange(18),added_before);

f = [1,2,3,0,0,0]
g = [-0.5, 0.5, 0.1]

subplot(121)
stem(arange(6),f)
xlim((-0.5, 4.5))
subplot(122)
stem(arange(3),g)
xlim((-0.5, 4.5))
(-0.5, 4.5)

markerline, stemlines, baseline  = stem(arange(5),convolve(array([1,0,0]),g))

markerline, stemlines, baseline  = stem(arange(5),convolve(array([0,2,0]),g), 'g', 'og')

markerline, stemlines, baseline  = stem(arange(5),convolve(array([0,0 ,3]),g), 'r', 'or')
markerline.set_color('r')
grid()

xlim((-0.5, 4.5))
ylim((-2, 2))
(-2, 2)

Now doing it manually without the convolution function:
f = array([0.3, 0.2, -0.5, 0, -0.1, 0.1, 0.25 ])
stem(f)
<Container object of 3 artists>

g = array([0.1, 0.2, -0.1])
stem(g)
<Container object of 3 artists>

fg0 = f[0] * g
subplot(211)
stem(fg0)
subplot(212)
stem(g)
<Container object of 3 artists>

fg1 = f[1] * g
stem(fg1)
<Container object of 3 artists>

But we need to shift it in time to place it at the position of f[1]
fg1 = r_[0, fg1]
stem(fg1)
<Container object of 3 artists>

fg2 = f[2] * g
fg2 = r_[0, 0, fg2]
stem(fg2)
<Container object of 3 artists>

Now we need to add them
def hide_axes(ax):
    ax.spines["top"].set_visible(False)
    ax.spines["right"].set_visible(False)
    ax.spines["bottom"].set_visible(False)
    ax.spines["left"].set_visible(False)
    tick_params(axis="both", which="both", bottom="off", top="off",
                labelbottom="off", left="off", right="off", labelleft="on")
subplot(511)
stem(fg0)
xlim(0,6)
ylim(-0.1, 0.1)
hide_axes(gca())

subplot(512)
stem(fg1)
xlim(0,6)
ylim(-0.1, 0.1)
hide_axes(gca())


subplot(513)
stem(fg2)
xlim(0,6)
ylim(-0.1, 0.1)
hide_axes(gca())


subplot(514)
stem(f)

xlim(0,6)


subplot(515)
stem(g[::-1])

xlim(0,6)


gcf().set_figheight(8)

def apply_ir(f , n, g):
    fg = f[n] * g
    fg = r_[zeros(n), fg, zeros(len(g) + len(f) - len(fg) - n - 1 )]
    return fg
fg = apply_ir(f, 6, g)
stem(fg)
<Container object of 3 artists>

convolved = zeros(9)
for i in range(len(f)):
    convolved += apply_ir(f, i, g)
stem(convolved)
<Container object of 3 artists>

stem(convolve(f,g))
<Container object of 3 artists>
Same result!
Filtering and Convolution
Convolution can be used the mechanism to realize FIR filters.
f = random.random(4096) - 0.5
specgram(f);

g = ones(30)/30.0
plot(f)
figure()
stem(g)
<Container object of 3 artists>


fg = convolve(f, g)
Pxx, freqs, bins, im = specgram(fg);

plot(Pxx[:, 10])
[<matplotlib.lines.Line2D at 0x7fcb7042b610>]

from scipy.signal import freqz
w, h = freqz(g)
plot(w, abs(h))
twinx()
plot(w, angle(h), 'r')
[<matplotlib.lines.Line2D at 0x7fcb7065fe10>]

Convolution in the time domain is multiplication in the frequency domain!
plot(abs(fft.rfft(g)), 'o-')
[<matplotlib.lines.Line2D at 0x7fcb5b49fa10>]

plot(abs(fft.rfft(g, n=512)))
twinx()
plot(angle(fft.rfft(g, n=512)), 'r')
[<matplotlib.lines.Line2D at 0x7fcb5b3d3710>]

window = f[:256]
plot(abs(rfft(window)))
[<matplotlib.lines.Line2D at 0x7fcb5b27e650>]

plot(abs(rfft(window)*rfft(g, n=256)))
[<matplotlib.lines.Line2D at 0x7fcb5b228d10>]

Convolution can be used for filtering but also with long IRs for reverb.
By: Andrés Cabrera mantaraya36@gmail.com For MAT course MAT 201A at UCSB
This ipython notebook is licensed under the CC-BY-NC-SA license: http://creativecommons.org/licenses/by-nc-sa/4.0/
