K-nearest neighbors and scikit-learn
Agenda
- K-nearest neighbors (KNN)
- Review of the iris dataset
- Human learning on the iris dataset
- KNN classification
- Review of supervised learning
- scikit-learn
- Requirements for working with data in scikit-learn
- scikit-learn's 4-step modeling pattern
- Tuning a KNN model
- Comparing KNN with other models
Review of the iris dataset
In [1]:
# read the iris data into a DataFrame
import pandas as pd
col_names = ['sepal_length', 'sepal_width', 'petal_length', 'petal_width', 'species']
iris = pd.read_csv('http://archive.ics.uci.edu/ml/machine-learning-databases/iris/iris.data', header=None, names=col_names)
In [2]:
iris.head()
Out[2]:
| sepal_length | sepal_width | petal_length | petal_width | species | |
|---|---|---|---|---|---|
| 0 | 5.1 | 3.5 | 1.4 | 0.2 | Iris-setosa |
| 1 | 4.9 | 3.0 | 1.4 | 0.2 | Iris-setosa |
| 2 | 4.7 | 3.2 | 1.3 | 0.2 | Iris-setosa |
| 3 | 4.6 | 3.1 | 1.5 | 0.2 | Iris-setosa |
| 4 | 5.0 | 3.6 | 1.4 | 0.2 | Iris-setosa |
Terminology
- 150 observations (n=150): each observation is one iris flower
- 4 features (p=4): sepal length, sepal width, petal length, and petal width
- Response: iris species
- Classification problem since response is categorical
Human learning on the iris dataset
How did we (as humans) predict the species for iris flowers?
- We looked for features that seemed to correlate with the response.
- We created a set of rules (using those features) to predict the species of an unknown iris.
More generally:
- We observed that the different species had (somewhat) dissimilar measurements.
- We predicted the species for an unknown iris by:
- Looking for irises in the data with similar measurements
- Assuming that our unknown iris is the same species as those similar irises
In [3]:
# allow plots to appear in the notebook
%matplotlib inline

# create a custom colormap
from matplotlib.colors import ListedColormap
cmap_bold = ListedColormap(['#FF0000', '#00FF00', '#0000FF'])

# map each iris species to a number
iris['species_num'] = iris.species.map({'Iris-setosa':0, 'Iris-versicolor':1, 'Iris-virginica':2})
In [4]:
# create a scatter plot of PETAL LENGTH versus PETAL WIDTH and color by SPECIES
iris.plot(kind='scatter', x='petal_length', y='petal_width', c='species_num', colormap=cmap_bold)
Out[4]:
<matplotlib.axes._subplots.AxesSubplot at 0xc1a7940>

In [5]:
# create a scatter plot of SEPAL LENGTH versus SEPAL WIDTH and color by SPECIES
iris.plot(kind='scatter', x='sepal_length', y='sepal_width', c='species_num', colormap=cmap_bold)
Out[5]:
<matplotlib.axes._subplots.AxesSubplot at 0xc2e0320>

K-nearest neighbors (KNN) classification
- Pick a value for K.
- Search for the K observations in the data that are "nearest" to the measurements of the unknown iris.
- Euclidian distance is often used as the distance metric, but other metrics are allowed.
- Use the most popular response value from the K "nearest neighbors" as the predicted response value for the unknown iris.
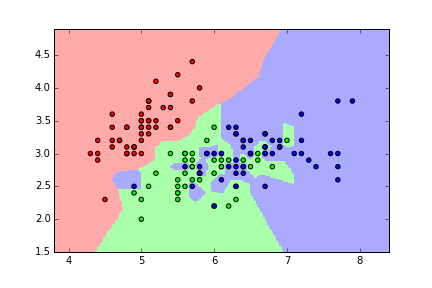
KNN classification map for iris (K=1)
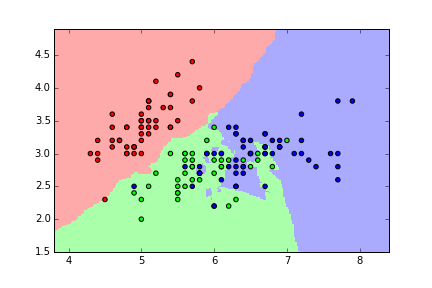
KNN classification map for iris (K=5)
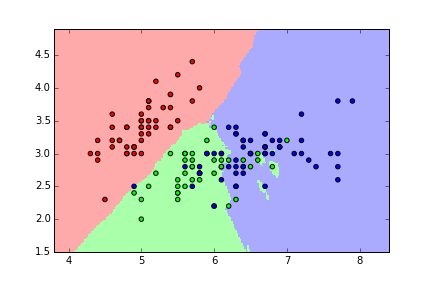
KNN classification map for iris (K=15)
KNN classification map for iris (K=50)
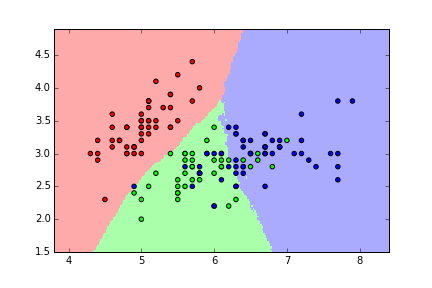
Question: What's the "best" value for K in this case?
Answer: The value which produces the most accurate predictions on unseen data. We want to create a model that generalizes!
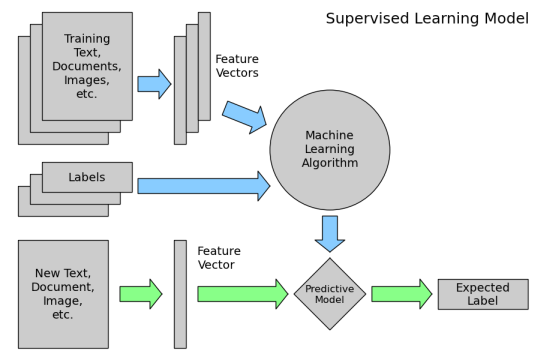
Review of supervised learning
Requirements for working with data in scikit-learn
- Features and response are separate objects
- Features and response should be entirely numeric
- Features and response should be NumPy arrays (or easily convertible to NumPy arrays)
- Features and response should have specific shapes (outlined below)
In [6]:
iris.head()
Out[6]:
| sepal_length | sepal_width | petal_length | petal_width | species | species_num | |
|---|---|---|---|---|---|---|
| 0 | 5.1 | 3.5 | 1.4 | 0.2 | Iris-setosa | 0 |
| 1 | 4.9 | 3.0 | 1.4 | 0.2 | Iris-setosa | 0 |
| 2 | 4.7 | 3.2 | 1.3 | 0.2 | Iris-setosa | 0 |
| 3 | 4.6 | 3.1 | 1.5 | 0.2 | Iris-setosa | 0 |
| 4 | 5.0 | 3.6 | 1.4 | 0.2 | Iris-setosa | 0 |
In [7]:
# store feature matrix in "X"
feature_cols = ['sepal_length', 'sepal_width', 'petal_length', 'petal_width']
X = iris[feature_cols]
In [8]:
# alternative ways to create "X"
X = iris.drop(['species', 'species_num'], axis=1)
X = iris.loc[:, 'sepal_length':'petal_width']
X = iris.iloc[:, 0:4]
In [9]:
# store response vector in "y"
y = iris.species_num
In [10]:
# check X's type
print type(X)
print type(X.values)
<class 'pandas.core.frame.DataFrame'>
<type 'numpy.ndarray'>
In [11]:
# check y's type
print type(y)
print type(y.values)
<class 'pandas.core.series.Series'>
<type 'numpy.ndarray'>
In [12]:
# check X's shape (n = number of observations, p = number of features)
print X.shape
(150, 4)
In [13]:
# check y's shape (single dimension with length n)
print y.shape
(150L,)
scikit-learn's 4-step modeling pattern
Step 1: Import the class you plan to use
In [14]:
from sklearn.neighbors import KNeighborsClassifier
Step 2: "Instantiate" the "estimator"
- "Estimator" is scikit-learn's term for "model"
- "Instantiate" means "make an instance of"
In [15]:
knn = KNeighborsClassifier(n_neighbors=1)
- Name of the object does not matter
- Can specify tuning parameters (aka "hyperparameters") during this step
- All parameters not specified are set to their defaults
In [16]:
print knn
KNeighborsClassifier(algorithm='auto', leaf_size=30, metric='minkowski',
           metric_params=None, n_neighbors=1, p=2, weights='uniform')
Step 3: Fit the model with data (aka "model training")
- Model is "learning" the relationship between X and y in our "training data"
- Process through which learning occurs varies by model
- Occurs in-place
In [17]:
knn.fit(X, y)
Out[17]:
KNeighborsClassifier(algorithm='auto', leaf_size=30, metric='minkowski',
           metric_params=None, n_neighbors=1, p=2, weights='uniform')
- Once a model has been fit with data, it's called a "fitted model"
Step 4: Predict the response for a new observation
- New observations are called "out-of-sample" data
- Uses the information it learned during the model training process
In [18]:
knn.predict([3, 5, 4, 2])
Out[18]:
array([2], dtype=int64)
- Returns a NumPy array, and we keep track of what the numbers "mean"
- Can predict for multiple observations at once
In [19]:
X_new = [[3, 5, 4, 2], [5, 4, 3, 2]]
knn.predict(X_new)
Out[19]:
array([2, 1], dtype=int64)
Tuning a KNN model
In [20]:
# instantiate the model (using the value K=5)
knn = KNeighborsClassifier(n_neighbors=5)

# fit the model with data
knn.fit(X, y)

# predict the response for new observations
knn.predict(X_new)
Out[20]:
array([1, 1], dtype=int64)
In [21]:
# calculate predicted probabilities of class membership
knn.predict_proba(X_new)
Out[21]:
array([[ 0. ,  0.8,  0.2],
       [ 0. ,  1. ,  0. ]])
In [22]:
# print distances to nearest neighbors (and their identities)
knn.kneighbors([3, 5, 4, 2])
Out[22]:
(array([[ 3.19374388,  3.20312348,  3.24037035,  3.35559235,  3.35559235]]),
 array([[106,  84,  59,  88,  66]], dtype=int64))
Comparing KNN with other models
Advantages of KNN:
- Simple to understand and explain
- Model training is fast
- Can be used for classification and regression!
Disadvantages of KNN:
- Must store all of the training data
- Prediction phase can be slow when n is large
- Sensitive to irrelevant features
- Sensitive to the scale of the data
- Accuracy is (generally) not competitive with the best supervised learning methods