IPython notebook: visualization in context
%run talktools
%matplotlib inline
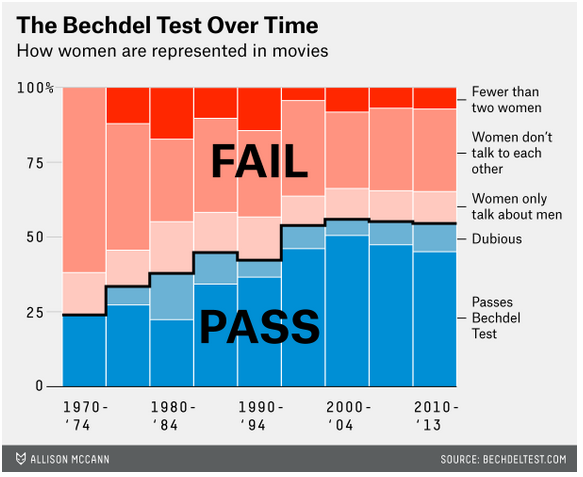
The Bechdel Test
"The Rule": female film characters have depth if...

|
|
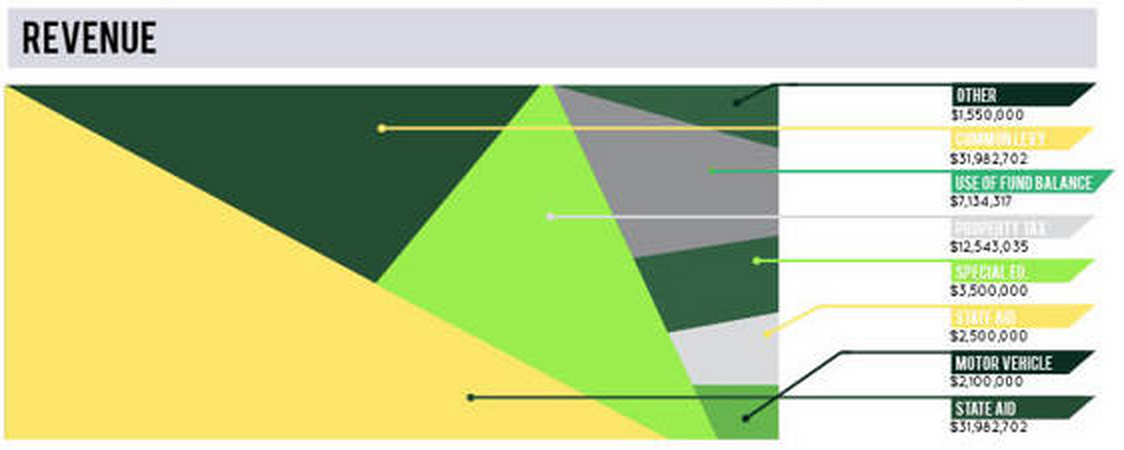
The results: gender bias is not profitable!

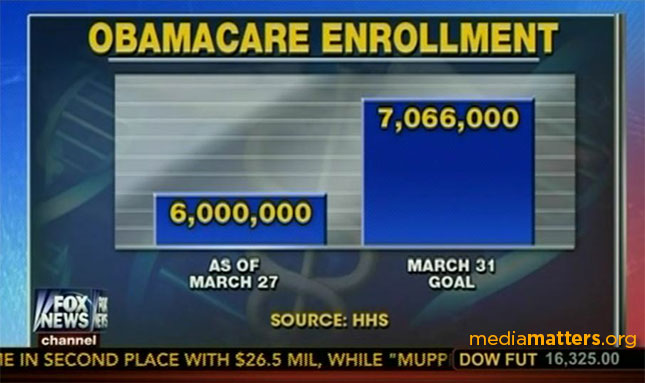
What's wrong with the FiveThirtyEight results?
Blog Post by Brian Keegan
The Need for Openness in Data Journalism
Thesis: journalists should subject themselves to the same reproducibility and openness standards as scientist.
Keegan: "I have found this “new” brand of data journalism disappointing foremost because it wants to perform science without abiding by scientific norms."
The takeaway
As data scientists, we should be as offended by obfuscated data as designers are by obfuscating design.
 |  |
Brian's Response to FiveThirtyEight
Walking the walk...
from IPython.display import IFrame
IFrame("http://nbviewer.ipython.org/github/brianckeegan/Bechdel/blob/master/Bechdel_test.ipynb", 800, 600)
To their credit, FiveThirtyEight responded and put their data on GitHub.
def fibonacci():
    a, b = 0, 1
    while True:
        yield a
        a, b = b, a + b

for i, f in enumerate(fibonacci()):
    print f,
    if i > 35:
        break
0 1 1 2 3 5 8 13 21 34 55 89 144 233 377 610 987 1597 2584 4181 6765 10946 17711 28657 46368 75025 121393 196418 317811 514229 832040 1346269 2178309 3524578 5702887 9227465 14930352
We can write paragraphs of text
Lorem ipsum dolor sit amet, consectetur adipisicing elit, sed do eiusmod tempor incididunt ut labore et dolore magna aliqua. Ut enim ad minim veniam, quis nostrud exercitation ullamco laboris nisi ut aliquip ex ea commodo consequat. Duis aute irure dolor in reprehenderit in voluptate velit esse cillum dolore eu fugiat nulla pariatur. Excepteur sint occaecat cupidatat non proident, sunt in culpa qui officia deserunt mollit anim id est laborum.
We can write math using TeX
$$ \int x^n \exp[-x]dx = \Gamma(n + 1, x)$$We can write lists
- Lorem ipsum dolor sit amet
- consectetur adipisicing elit
- sed do eiusmod tempor incididunt
- ut labore et dolore magna aliqua
We can embed static figures
import matplotlib.pyplot as plt
import numpy as np

x, y = np.random.normal(size=(2, 100))
s, c = np.random.random(size=(2, 100))

plt.scatter(x, y, c=c, s=1000 * s, alpha=0.3);

The core viz tool: matplotlib
Lots of visualization types are available: e.g. matplotlib gallery
# %load http://matplotlib.org/mpl_examples/mplot3d/bars3d_demo.py
from mpl_toolkits.mplot3d import Axes3D
import matplotlib.pyplot as plt
import numpy as np

fig = plt.figure()
ax = fig.add_subplot(111, projection='3d')
for c, z in zip(['r', 'g', 'b', 'y'], [30, 20, 10, 0]):
    xs = np.arange(20)
    ys = np.random.rand(20)

    # You can provide either a single color or an array. To demonstrate this,
    # the first bar of each set will be colored cyan.
    cs = [c] * len(xs)
    cs[0] = 'c'
    ax.bar(xs, ys, zs=z, zdir='y', color=cs, alpha=0.8)

ax.set_xlabel('X')
ax.set_ylabel('Y')
ax.set_zlabel('Z')

plt.show()

Notebooks can be shared online
IPython's "nbviewer" website: http://nbviewer.ipython.org
from IPython.display import IFrame
IFrame("http://nbviewer.ipython.org", 800, 600)
Many people use IPython to blog as well
Here is an example from my own blog: a post written in IPython notebook and published to the web
IFrame("http://jakevdp.github.io/blog/2013/08/28/understanding-the-fft/", 800, 600)

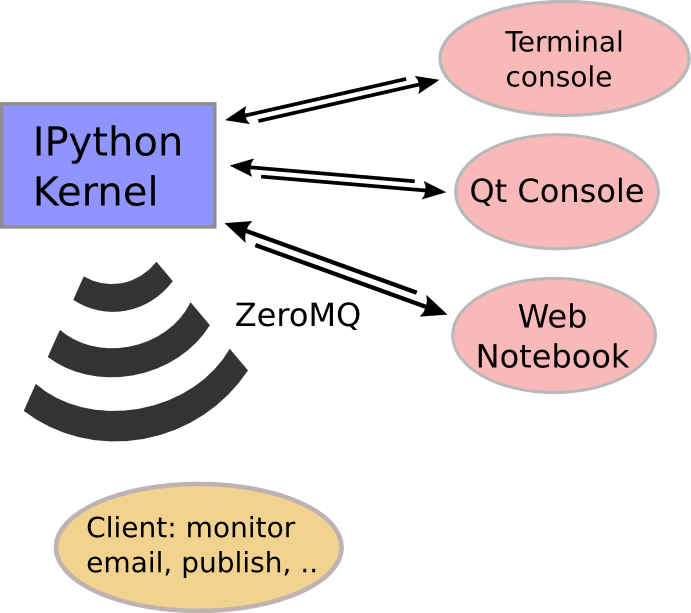
So What Is IPython?
"Tools for the entire lifecycle of a scientific idea"
From exploration to collaboration to publication to reproduction of results.
Code + Description + Data + Visualization in one place = True Openness and Reproducibility!
Picking on Nate Silver again...
- 2012 FiveThirtyEight Election re-analysis by Skipper Seabold
Many more notebooks to explore
JS-enabled Frontend gives us huge flexibility
That is, we can create simple Python scripts that display javascript results:
from intfact import factorizer
factorizer()
(thanks to Brian Granger and Jon Frederic)
We'll see more of this later...
IPython is not just for Python...
The Kernel/message passing system is generic enough to not need Python!
Via language magics and language kernels, the notebook can be used with an ever-expanding list of programming languages!