Working with the IPython notebook
Gert-Ludwig Ingold
From Newton's notebook
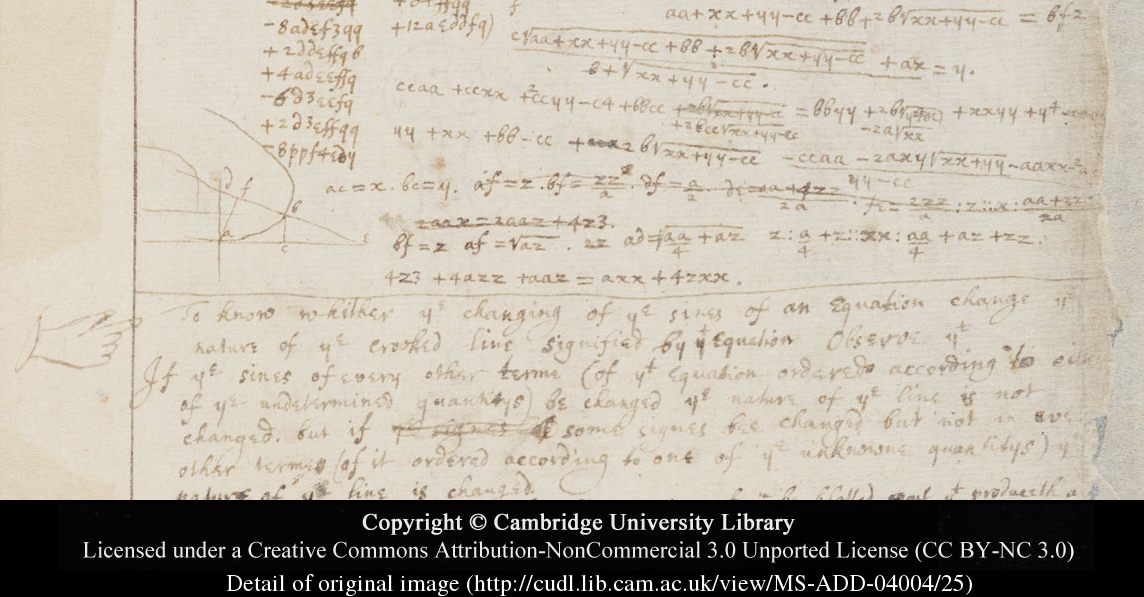
From Newton to a modern notebook
- explanations
text which may be structured and contain formulae - mathematical manipulations
code and results
- diagrams
graphical representations and multimedia objects
- representation
HTML, PDF, …
Applications of notebooks
- Development of small Python scripts
example: optimization for Cython - Documentation
example: data analysis - Teaching material
examples: lectures, programming course - Textbooks
examples: nbviewer.ipython.org, books section - Presentation
with notebook extension RISE by Damián Avila
- …
Python
- interpreted language
- relatively easy to learn
- "Python comes with batteries included"
- SciPy stack: NumPy, SciPy, Matplotlib, pandas,...
IPython - the improved Python shell
- 2001: Fernando Pérez launches the IPython project.
- December 2011: IPython 0.12 introduces the IPython notebook.
- 2013–2014: The development of IPython is supported by the Alfred P. Sloan foundation with 1.15 M
$. - August 2013: Microsoft supports the development of IPython with 100.000
$. - February, 27 2015: Release of Version 3.0.
- May 2015: IPython is part of the Horizon 2020 project OpenDreamKit
- Next milestone: The language agnostic part moves to the Jupyter project.
IPython sources
Homepage: ipython.org
Repository: github.com/ipython/ipython
Mailing list: ipython-dev@scipy.org
Debian and Ubuntu packages:
ipython-notebook / ipython3-notebook
ipython 1.2.1: Debian wheezy-backports, Ubuntu 14.04LTS
ipython 2.3.0: Debian jessie, Ubuntu 15.04
ipython 3.1.0: pypi.python.org
Installation within a virtual environment
pip install "ipython[notebook]"
see also: ipython.org/install.html
Notebook cells
- Code cells
- Text cells
- Raw cells for interpretation by
NBConvert
Working with notebook cells
A selected notebook cell is in one of two modes:
- command mode = black frame
- input mode = green frame and pencil symbol in header
- switch to input mode:
ENTERor doubleclick - switch to command mode:
ESCorCTRL-M
Useful keyboard shortcuts
SHIFT-ENTER,CTRL-ENTER: execute the selected cellALT-ENTER: execute the selected cell and open a new oneA: insert a new cell above the present cellB: insert a new cell below the present cellD,D: delete the selected cellM: define selected cell as markdown cellH: display all keyboard shortcuts
Code cells
for n in range(3):
    print("The IPython notebook is great.")
Code cells are numbered in the sequence in which they are executed.
Magics can be used to insert and execute code not written in Python, e.g. HTML:
%%html
<style>
div.text_cell_render h3 {
    color: #c60;
}
</style>
Text cells
Formatting can be down in markdown and HTML.
Examples:
- text in italics oder text in italics
- text in bold oder text in bold
code- emphasized text
Mathematical typesetting
LaTeX syntax can be used in text cells to display mathematical symbols like $\ddot x$ or entire formulae: $$\mathcal{L}\{f(t)\} = \int_0^\infty\text{d}z\text{e}^{-zt}f(t)$$
Mathematics is displayed with MathJax (www.mathjax.org) and requires either an internet connection or a local installation. Instructions for a local installation can be obtained as follows:
from IPython.external import mathjax
mathjax?
Selected features of the IPython shell
Help
import numpy as np
np.tensordot?
Description including code (if available)
np.tensordot??
Code completion with TAB
np.ALLOW_THREADS
Reference to earlier results
2**3
_-8
__**2
Access to all earlier input and output
In, Out
Magics in IPython
%lsmagic
Quick reference
%quickref
Timing of code execution
%timeit 2.5**100
import math
%%timeit
result = []
nmax = 100000
dx = 0.001
for n in range(nmax):
    result.append(math.sin(n*dx))
%%timeit
nmax = 100000
dx = 0.001
x = np.arange(nmax)*dx
result = np.sin(x)
Extended representations
IPython allows for the representation of objects in formats as different as
- HTML
- Markdown
- SVG
- PNG
- JPEG
- LaTeX
from IPython.display import Image
Image("./images/ipython_logo.png")
from IPython.display import HTML
HTML('<iframe src="http://www.ipython.org" width="700" height="500"></iframe>')
Even the embedding of audio and video files is possible.
from IPython.display import YouTubeVideo
YouTubeVideo('F4rFuIb1Ie4')
Python allows for a textual representation of objects by means of the __repr__ method.
example:
class MyObject(object):
    def __init__(self, obj):
        self.obj = obj

    def __repr__(self):
        return ">>> {0!r} / {0!s} <<<".format(self.obj)

x = MyObject('Python')
print(x)
A rich representation of objects is possible in the IPython notebook provided the corresponding methods are defined:
_repr_pretty__repr_html__repr_markdown__repr_latex_repr_svg__repr_json__repr_javascript__repr_png__repr_jpeg_
Note: In contrast to __repr__ only one underscore is used.
class RGBColor(object):
    def __init__(self, r, g, b):
        self.colordict = {"r": r, "g":g, "b": b}

    def _repr_svg_(self):
        return '''<svg height="50" width="50">
                    <rect width="50" height="50" fill="rgb({r},{g},{b})" />
                  </svg>'''.format(**self.colordict)

c = RGBColor(205, 128, 255)
c
from fractions import Fraction
class MyFraction(Fraction):
def _repr_html_(self):
return "<sup>%s</sup>⁄<sub>%s</sub>" % (self.numerator,
self.denominator)
def _repr_latex_(self):
return r"$\frac{%s}{%s}$" % (self.numerator, self.denominator)
def __add__(a, b):
"""a + b"""
return MyFraction(a.numerator * b.denominator +
b.numerator * a.denominator,
a.denominator * b.denominator)
MyFraction(12, 345)+MyFraction(67, 89)
from IPython.display import display_latex
display_latex(MyFraction(12, 345)+MyFraction(67, 89))
Interaction with widgets
from IPython.html.widgets import interact
@interact(x=(0., 10.), y=(0, 10))
def power(y, x=2):
    print(x**y)
Data types and their associated widgets
String (str, unicode) → Text
Dictionary (dict) → Dropdown
Boolean variable (bool) → Checkbox
Float (float) → FloatSlider
Integer (int) → IntSlider
@interact(x=(0, 5),
          text="Python is great!!!")
def f(text, x=0):
    for _ in range(x):
        print(text)
from IPython.html import widgets
import numpy as np
import matplotlib.pyplot as plt
%matplotlib inline
# otherwise matplotlib graphs will be displayed in an external window

@interact(harmonics=widgets.IntSlider(min=1, max=10,
                                      description='Number of harmonics',
                                      padding='2ex'),
          function=widgets.RadioButtons(options=("square",
                                                  "sawtooth",
                                                  "triangle"),
                                        description='Function')
          )
def f(harmonics, function):
    params = {"square": {"sign":1, "stepsize": 2, "func": np.sin, "power": 1},
              "sawtooth": {"sign": -1, "stepsize": 1, "func": np.sin, "power": 1},
              "triangle": {"sign": 1, "stepsize": 2, "func":  np.cos, "power": 2}
              }
    p = params[function]
    xvals, nvals = np.ogrid[-2*np.pi:2*np.pi:100j, 1:harmonics+1:p["stepsize"]]
    yvals = np.sum(p["sign"]**nvals*p["func"](nvals*xvals)/nvals**p["power"],
                   axis=1)
    plt.plot(xvals, yvals)
See also the tutorial by Cyrille Rossant at https://github.com/rossant/euroscipy2014.
Transformation of IPython-Notebooks to various output formats
ipython notebook --to format notebook filename
Output formats:
- HTML for presentation with
reveal.js - LaTeX, PDF
- Markdown
- Restructured text
- Python
Static representation of notebooks: nbviewer.ipython.org