Arbeiten mit dem IPython-Notebook
Gert-Ludwig Ingold
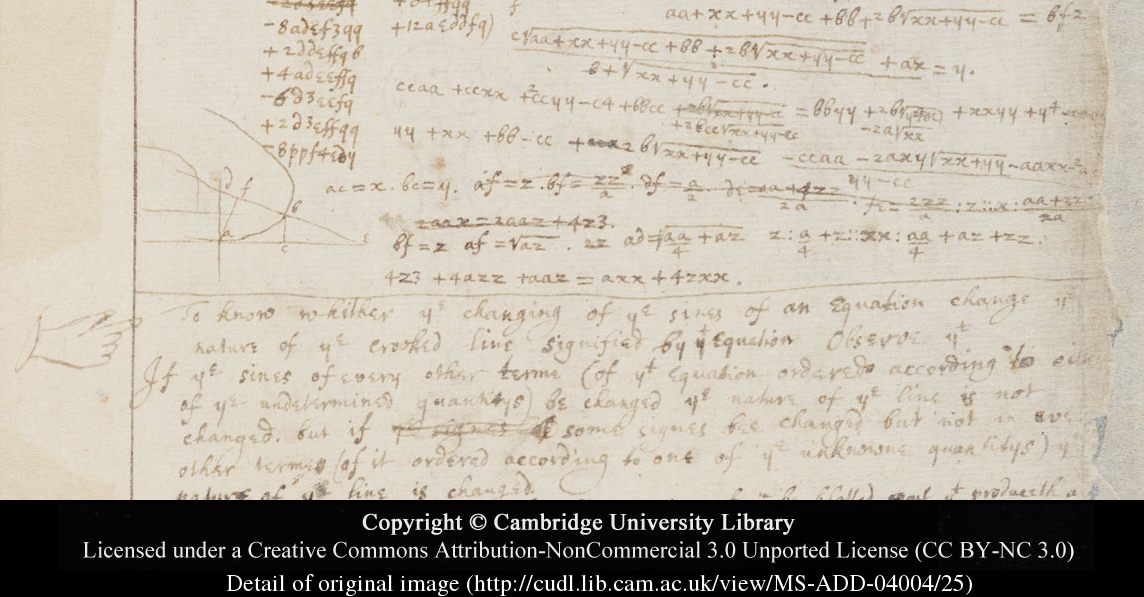
Aus Newtons Notizbuch
Von Newton zum modernen Notebook
- Erläuterungen
Text, der Gliederungen und mathematische Formeln enthalten kann - mathematische Umformungen
Programmcode und das daraus resultierende Ergebnis
- Abbildungen
graphische Darstellungen und Multimedia-Objekte
- Darstellung
HTML, PDF, …
Anwendungen von Notebooks
- Entwicklung kleinerer Python-Skripte
Beispiel: Optimierung für Cython - Dokumentation
Beispiel: Datenanalyse - Lehrmaterial
Beispiele: Unterricht, Programmierkurs - Lehrbücher
Beispiele: nbviewer.ipython.org, Abschnitt Books - Präsentation mit Notebook-Erweiterung RISE von Damián Avila
- …
Python
- interpretierte Sprache
- vergleichsweise leicht erlernbar
- "Python comes with batteries included"
- SciPy Stack: NumPy, SciPy, Matplotlib, pandas,...
IPython - die verbesserte Python-Shell
- 2001: Start des IPython Projekts durch Fernando Pérez.
- Dezember 2011: Mit IPython 0.12 wird das IPython Notebook eingeführt.
- 2013–2014: Die Entwicklung von IPython wird mit 1.15 Millionen Dollar von der Alfred P. Sloan Stiftung unterstützt.
- August 2013: Microsoft unterstützt die Entwicklung von IPython mit 100.000 Dollar.
- 27. Februar 2015: Freigabe der Version 3.0.
- Teilaspekt des Horizon-2020-Projekts OpenDreamKit
- Nächster Meilenstein: Der sprachunabhängige Teil geht in das Jupyter-Projekt über.
IPython-Quellen
Homepage: ipython.org
Repository: github.com/ipython/ipython
Mailing-Liste: ipython-dev@scipy.org
Pakete für Debian und Ubuntu:
ipython-notebook / ipython3-notebook
ipython 1.2.1: Debian wheezy-backports, Ubuntu 14.04LTS
ipython 2.3.0: Debian jessie, Ubuntu 15.04
ipython 3.1.0: pypi.python.org
Installation in ein virtual environment
pip install "ipython[notebook]"
siehe auch: ipython.org/install.html
Notebook-Zellen
- Codezellen
- Textzellen
- Zellen mit Rohdaten zur Interpretation durch
NBConvert
Umgang mit Notebook-Zellen
Die ausgewählte Notebook-Zelle befindet sich in einem von zwei Modi:
- Kommandomodus = schwarzer Rahmen
- Eingabemodus = grüner Rahmen und Stiftsymbol im Kopfbereich
- Wechsel in den Eingabemodus:
ENTERoder Doppelklicken - Wechsel in den Kommandomodus:
ESCoderSTRG-M
Nützliche Tastenkürzel
SHIFT-ENTER,STRG-ENTER: Ausführen der aktuellen ZelleALT-ENTER: Ausführen der aktuellen Zelle und Öffnen einer neuen ZelleA: Einfügen einer neuen Zelle über der aktuellen ZelleB: Einfügen einer neuen Zelle unter der aktuellen ZelleD,D: Löschen der aktuellen ZelleM: Definiere Zelle als Markdown-ZelleH: Anzeige aller Tastenkürzel
Codezellen
for n in range(3):
    print("Das IPython-Notebook ist toll.")
Die Codezellen werden in der Reihenfolge ihrer Ausführung nummeriert.
Unter Verwendung magischer Befehle kann man auch nicht in Python geschriebenen Code einbinden und ausführen, z.B. HTML:
%%html
<style>
div.text_cell_render h3 {
    color: #c60;
}
</style>
Textzellen
Zur Formatierung kann Markdown und HTML verwendet werden.
Beispiele:
- Kursiver Text oder Kursiver Text
- Fetter Text oder Fetter Text
Code- hervorgehobener Text
Mathematiksatz
In Textzellen kann LaTeX-Syntax verwendet werden, um mathematische Symbole wie z.B. $\ddot x$ oder aber ganze Formeln darzustellen: $$\mathcal{L}\{f(t)\} = \int_0^\infty\text{d}z\text{e}^{-zt}f(t)$$
Hierzu wird MathJax (www.mathjax.org) verwendet, das entweder eine Internetanbindung oder eine lokale Installation erfordert. Hinweise zur lokalen Installation erhält man zum Beispiel folgendermaßen:
from IPython.external import mathjax
mathjax?
Ausgewählte Vorteile der IPython-Shell
Hilfe
import numpy as np
np.tensordot?
Beschreibung mit Code (falls möglich)
np.tensordot??
Codeergänzung mit TAB
np.
Bezug auf frühere Ergebnisse
2**3
_-8
__**2
Zugriff auf alle früheren Ein- und Ausgaben
In, Out
Magische Befehle in IPython...
%lsmagic
Schnellanleitung
%quickref
Laufzeitbestimmungen
%timeit 2.5**100
import math
%%timeit
result = []
nmax = 100000
dx = 0.001
for n in range(nmax):
    result.append(math.sin(n*dx))
%%timeit
nmax = 100000
dx = 0.001
x = np.arange(nmax)*dx
result = np.sin(x)
Erweiterte Darstellungsmöglichkeiten
IPython erlaubt eine Darstellung von Objekten in verschiedenen Formaten wie
- HTML
- Markdown
- SVG
- PNG
- JPEG
- LaTeX
from IPython.display import Image
Image("./images/ipython_logo.png")
from IPython.display import HTML
HTML('<iframe src="http://www.ipython.org" width="700" height="500"></iframe>')
Auch die Einbindung von Audio- und Video-Dateien ist möglich
from IPython.display import YouTubeVideo
YouTubeVideo('F4rFuIb1Ie4')
Python erlaubt die textliche Darstellung von Objekten mit der __repr__-Methode.
Beispiel:
class MyObject(object):
    def __init__(self, obj):
        self.obj = obj

    def __repr__(self):
        return ">>> {0!r} / {0!s} <<<".format(self.obj)

x = MyObject('Python')
print(x)
Im IPython-Notebook ist eine reichhaltige Darstellung von Objekten durch Bereitstellung von entsprechenden Methoden möglich:
_repr_pretty__repr_html__repr_markdown__repr_latex_repr_svg__repr_json__repr_javascript__repr_png__repr_jpeg_
Achtung: jeweils nur ein Unterstrich im Gegensatz zu __repr__
class RGBColor(object):
    def __init__(self, r, g, b):
        self.colordict = {"r": r, "g":g, "b": b}

    def _repr_svg_(self):
        return '''<svg height="50" width="50">
                    <rect width="50" height="50" fill="rgb({r},{g},{b})" />
                  </svg>'''.format(**self.colordict)

c = RGBColor(205, 128, 255)
c
from fractions import Fraction
class MyFraction(Fraction):
def _repr_html_(self):
return "<sup>%s</sup>⁄<sub>%s</sub>" % (self.numerator,
self.denominator)
def _repr_latex_(self):
return r"$\frac{%s}{%s}$" % (self.numerator, self.denominator)
def __add__(a, b):
"""a + b"""
return MyFraction(a.numerator * b.denominator +
b.numerator * a.denominator,
a.denominator * b.denominator)
MyFraction(12, 345)+MyFraction(67, 89)
from IPython.display import display_latex
display_latex(MyFraction(12, 345)+MyFraction(67, 89))
Interaktion mit Widgets
from IPython.html.widgets import interact
@interact(x=(0., 10.), y=(0, 10))
def power(y, x=2):
    print(x**y)
Datentypen und ihre Widgets
Zeichenkette (str, unicode) → Text
Dictionary (dict) → Dropdown
logische Variable (bool) → Checkbox
Gleitkommazahl (float) → FloatSlider
ganze Zahl (int) → IntSlider
@interact(x=(0, 5),
          text="Python ist toll!!!")
def f(text, x=0):
    for _ in range(x):
        print(text)
from IPython.html import widgets
import numpy as np
import matplotlib.pyplot as plt
%matplotlib inline
# sonst werden Matplotlib-Graphiken in einem externen Fenster angezeigt

@interact(harmonische=widgets.IntSlider(min=1, max=10,
                                        description='Anzahl der Harmonischen',
                                        padding='2ex'),
          funktion=widgets.RadioButtons(options=("Rechteck",
                                                  "Sägezahn",
                                                  "Dreieck"),
                                        description='Funktion')
          )
def f(harmonische, funktion):
    params = {"Rechteck": {"sign":1, "stepsize": 2, "func": np.sin, "power": 1},
              "Sägezahn": {"sign": -1, "stepsize": 1, "func": np.sin, "power": 1},
              "Dreieck": {"sign": 1, "stepsize": 2, "func":  np.cos, "power": 2}
              }
    p = params[funktion]
    xvals, nvals = np.ogrid[-2*np.pi:2*np.pi:100j, 1:harmonische+1:p["stepsize"]]
    yvals = np.sum(p["sign"]**nvals*p["func"](nvals*xvals)/nvals**p["power"], axis=1)
    plt.plot(xvals, yvals)
Siehe auch das Tutorial von Cyrille Rossant in https://github.com/rossant/euroscipy2014.
Umwandlung des IPython-Notebooks in verschiedene Ausgabeformate
ipython notebook --to format Notebook-Datei
Ausgabeformate:
- HTML für Ausgabe mit
reveal.js - LaTeX, PDF
- Markdown
- Restructured Text
- Python
Statische Darstellung von Notebooks: nbviewer.ipython.org