Geospatial analysis with Python
Valencia - PyConES 2015 - 2015/11/22
- Pedro-Juan Ferrer · @vehrka
- Jorge Sanz - @xurxosanz
- Geoinquietos Valencia - @geoinquietosvlc
Slides and repo
GEO Problem?

You have to deal with data that has special rules.
Rules based on a reality not told in schools
Earth is not a sphere

Earth is more like a potato
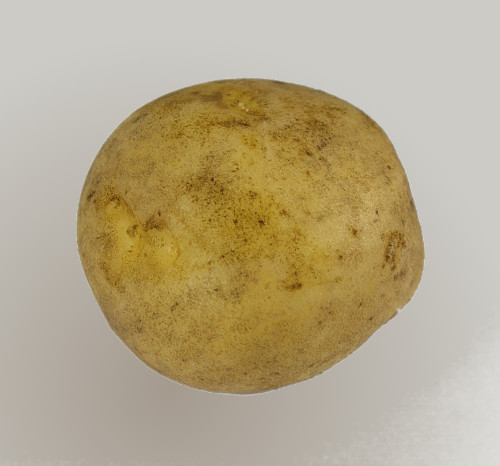
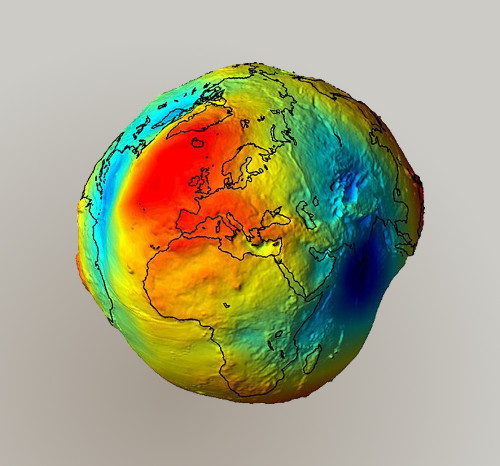
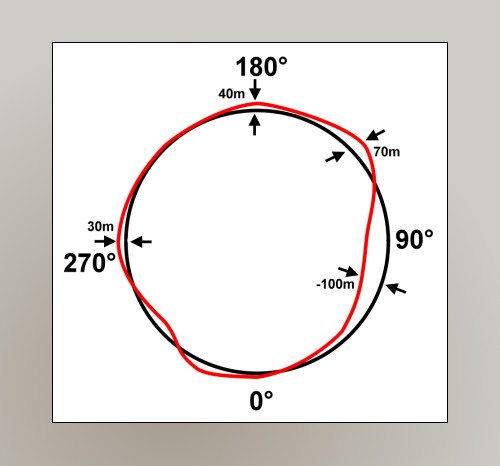
Earth is not a sphere
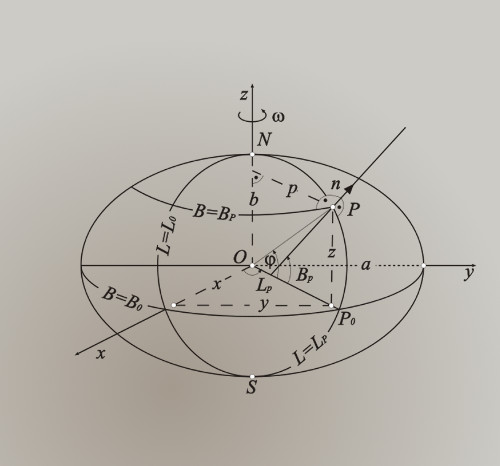
Remember
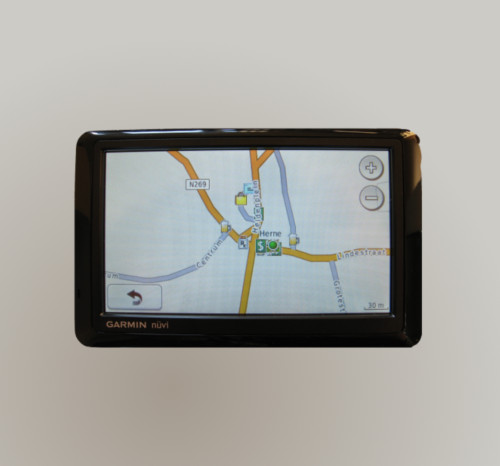
The GEO information lays over something mathematical that has its own rules.
THE DATUM
Maps are flat
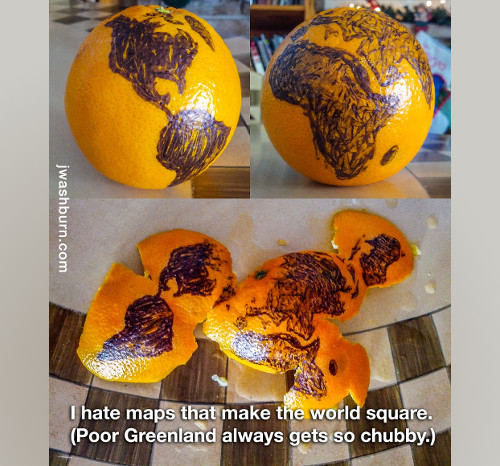
Breaking Flat
You have to choose what you want to break:
- Areas
- Angles
- Distances
In the best case you can choose two of the three.
(I'm skipping several courses on Cartography with this slide, trust me on this)
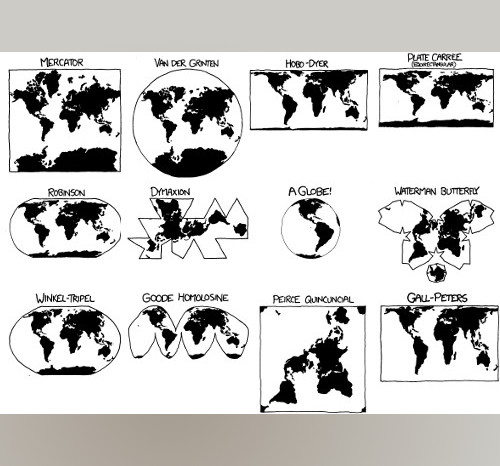
Maps are flat
Remember
The GEO information uses a mathematical trick to make things flat orderly.
THE PROJECTION
SRS and CRS
Toghether a DATUM and a PROJECTION make a CRS
The most famous catalog of CRS is EPSG
- EPSG:4326
- EPSG:3857 or EPSG:900913
- EPSG:4258
- EPSG:25830, EPSG:25831
lon/lat vs lat/lon
There's a little bit of fuss
In theory it should be lon/lat (x,y)
But we are used to lat/lon
Always check things ... twice
Recap
- Know your Datum
- Know your Projection
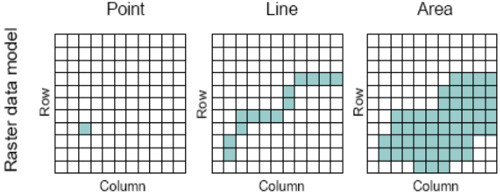
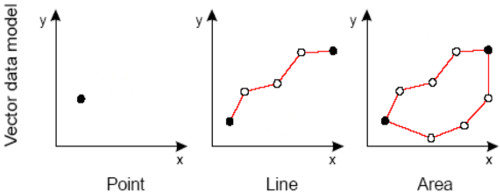
- Know your Data Type
- Know your Model
KNOW YOUR (geo) DATA!!!
2. Writing and reading data
from fiona.collection import supported_drivers
for frmt in sorted(supported_drivers):
    print("{:20}{}".format(frmt,supported_drivers[frmt]))
ARCGEN              r
AeronavFAA          r
BNA                 raw
DGN                 raw
DXF                 raw
ESRI Shapefile      raw
FileGDB             raw
GMT                 raw
GPKG                rw
GPSTrackMaker       raw
GPX                 raw
GeoJSON             rw
Idrisi              r
MapInfo File        raw
OpenFileGDB         r
PCIDSK              r
PDS                 r
SEGY                r
SUA                 r
Exercise
- Import a CSV and write into a geospatial file
- Read that file and explore contents
- Report
Writing a shapefile from a CSV
- reading a CSV from CartoDB SQL API (querying this table)
- creating a schema
- creating features and writing them
![]()
select
    ST_X(the_geom) as lon,
    ST_Y(the_geom) as lat,
    cartodb_id, actor_preferredusername, body, postedtime
from
    jsanz.twitter_pycones_pycones2015_pycones15
import requests
url = 'https://jsanz.cartodb.com:443/api/v2/sql?q=select ST_X(the_geom) as lon, ST_Y(the_geom) as lat, cartodb_id, actor_preferredusername, body, postedtime from jsanz.twitter_pycones_pycones2015_pycones15&format=csv'
csv_file = '/tmp/tweets.csv'

with open(csv_file,'w') as csvfile:
    req = requests.get(url)
    csvfile.write(req.text)
target = '/tmp/tweets.shp'
epsg = 4258 # http://epsg.io/4258
driver = "ESRI Shapefile"
schema = {
        "geometry": "Point",
        "properties": {
            ("cartodb_id", "int"),
            ("lon","float"),
            ("lat","float"),
            ("author","str"),
            ("body","str"),
            ("postedtime","str")
        }
}
import fiona, csv
from fiona.crs import from_epsg
output = fiona.open(target, "w", driver=driver,
                    crs=from_epsg(epsg), schema=schema)
with open(csv_file,'r') as csvfile:
    csvreader = csv.reader(csvfile,delimiter=',',quotechar='"')
    next(csvreader) #skip the header
    for line in csvreader:
        try:
            x = float(line[0])
            y = float(line[1])

            feature = {
                    "geometry" : {
                            "coordinates" : (x, y), "type" : "Point"
                    },
                    "properties" : {
                            "cartodb_id" : int(line[2]),
                            "lon" : x,
                            "lat" : y,
                            "author" : line[3],
                            "body" : line[4],
                            "postedtime" : line[5]
                    }
            }
            output.write(feature)
        except ValueError:
            pass
    try:
        output.close()
    except RuntimeError:
        pass
WARNING:Fiona:CPLE_AppDefined in b"One or several characters couldn't be converted correctly from UTF-8 to ISO-8859-1.\nThis warning will not be emitted anymore."
Reading and exploring data
- Open a Shapefile
- Getting information of the resource
- Looping over features
source = fiona.open(target, 'r')
" ".join([atr for atr in dir(source) if atr[0] != '_'])
'bounds close closed crs crs_wkt driver enabled_drivers encoding env filter flush guard_driver_mode items iterator keys meta mode name next path schema session validate_record validate_record_geometry values write writerecords'
print("{} tweets\r\n".format(len(source)))
print("bounds: {}\r\n".format(source.bounds))
print("CRS: {}".format(source.crs))
1031 tweets

bounds: (-123.26204, -43.24895, 151.77647, 55.95206)

CRS: {'no_defs': True, 'proj': 'longlat', 'ellps': 'GRS80'}
print("{:3} - {:15} - {:^15}\r\n{:*^45}".format("ID","Author","Coords",""))
for f in source[:10]:
    print("{:3} - {:15} - {}"
          .format(f['properties']['cartodb_id'],
                  f['properties']['author'],
                  f['geometry']['coordinates']))
ID  - Author          -     Coords
*********************************************
187 - rmajadas        - (-3.69063, 40.42526)
 39 - CValdeMontes    - (2.15899, 41.38879)
249 - python_granada  - (-3.60667, 37.18817)
247 - sdelquin        - (-16.25462, 28.46824)
105 - ipedrazas       - (-0.12574, 51.50853)
206 - rafbermudez     - (-3.69063, 40.42526)
192 - rafbermudez     - (-3.69063, 40.42526)
  9 - seattle113      - (-4.52406, 42.00955)
 35 - d1eg0_garc1a    - (2.15899, 41.38879)
 99 - ipedrazas       - (-0.12574, 51.50853)
Displaying the imported data
import folium
basemap = r'http://{s}.basemaps.cartocdn.com/light_all/{z}/{x}/{y}.png'
map = folium.Map(location=[39.5,-2.5],
                 zoom_start=6, width=960, height=600,
                 tiles=basemap, attr='OpenStreetMap and Twitter')
for f in source:
    x,y = f['geometry']['coordinates']
    map.simple_marker(
        [y,x], #lat/lon!!!
        popup=f['properties']['body'])
map

3. Processing
Shapely
- http://toblerity.org/shapely/
- 2D geometry processing
- Pythonic wrapper for GEOS
- Agnostic of coordinate systems or data formats
Exercise
- Define a point at PyConES venue
- Create a buffer of a radius of 100 km around it
- Find tweets inside that buffer
- Report
Create a point
We can use the Well Known Text format to define a Shapely geometry.
from shapely.wkt import loads
pycones = loads("POINT (-0.346713 39.482767)")
pycones

" ".join([ atr for atr in dir(pycones) if atr[0] != '_'])
'almost_equals area array_interface array_interface_base boundary bounds buffer centroid contains convex_hull coords covers crosses ctypes difference disjoint distance empty envelope equals equals_exact geom_type geometryType has_z impl interpolate intersection intersects is_closed is_empty is_ring is_simple is_valid length overlaps project relate relate_pattern representative_point simplify svg symmetric_difference to_wkb to_wkt touches type union within wkb wkb_hex wkt x xy y z'
print('pycones {}\r\n'.format('is valid'
                              if pycones.is_valid  else 'is not valid'))
print('WKT: {}\r\n'.format(pycones.wkt))
print('SVG: {}\r\n'.format(pycones.svg()))
pycones is valid

WKT: POINT (-0.346713 39.482767)

SVG: <circle cx="-0.346713" cy="39.482767" r="3.0" stroke="#555555" stroke-width="1.0" fill="#66cc99" opacity="0.6" />
Create a buffer
We cannot create a buffer of 100km around a geodetic point
We need to compute the buffer on a projected CRS
- Project the point to UTM coordinates
- Compute the buffer
- Project the buffer to lat/lon coordinates
Shapely provides a method to allow using pyproj with any geometry
import pyproj
from functools import partial
project = partial(
    pyproj.transform,
    pyproj.Proj(init='epsg:4258'),
    pyproj.Proj(init='epsg:25830')
)
project_inv = partial(
    pyproj.transform,
    pyproj.Proj(init='epsg:25830'),
    pyproj.Proj(init='epsg:4326')
)
import shapely.ops
pycones_25830 = shapely.ops.transform(project,pycones)
print(pycones_25830)
POINT (728199.1076832865 4373712.985082146)
Once projected we are ready to define a Shapely Point object, compute the buffer and project it back to lon/lat coordinates
from shapely.geometry import Point
p = Point(pycones_25830)
pycones_buffer_25830 = p.buffer(100000)
pycones_buffer = shapely.ops.transform(project_inv,pycones_buffer_25830)
pycones_buffer.bounds
(-1.5089067784607482,
 38.582592551915646,
 0.8139462109021063,
 40.38277685271952)
Intersect tweets
All ready to read the Shapefile, check if every feature is intersected by the buffer and fill a list of tuples with the distance and the tweet.
import fiona
from shapely.geometry import shape
tweets = []
with fiona.open('/tmp/tweets.shp','r') as source:
    for f in source:
        geometry = shape(f['geometry'])
        if pycones_buffer.intersects(geometry):
            geometry_25830 = shapely.ops.transform(project,geometry)
            distance = geometry_25830.distance(pycones_25830)
            tweets.append((distance,f))
print("{} tweets at less than 100km".format(len(tweets)))
118 tweets at less than 100km
WARNING: We need to transform to projected coordinates to get a distance in meters!
Let's sort the results and print the closest 10 tweets to PyConES venue
tweets = sorted(tweets, key=lambda tweet: tweet[0])
print("{:17} - {:>10} - {:>4}\r\n{:*^37}".format("Author","Distance","ID",""))
for distance,tweet in tweets[:10]:
    print("{:17} - {:10.2f} - {:4}"
          .format(tweet['properties']['author'],
                  distance,tweet['properties']['cartodb_id']))
Author            -   Distance -   ID
*************************************
ch_doig           -      30.17 -  666
ch_doig           -      58.11 -  583
ch_doig           -      60.24 -  601
manuerux          -     379.37 -  718
luiyo             -     514.44 -  779
xurxosanz         -     514.44 -  780
vero4ka_ru        -     514.44 -  783
sdelquin          -     917.01 -  806
andres_sanchis    -    3009.98 -  209
OFNblog           -    3009.98 -  262
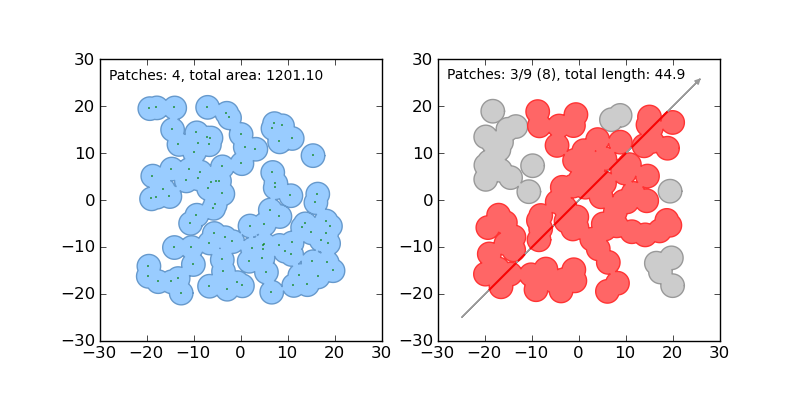
Displaying results
Let's use again folium but rendering also the buffer and with different colour for tweets inside.
basemap = r'http://{s}.basemaps.cartocdn.com/light_all/{z}/{x}/{y}.png'
map = folium.Map(location=[39.5,-2.5],
                 zoom_start=6, width=960, height=600,
                 tiles=basemap, attr='OpenStreetMap and Twitter')
buffer_coords = [ [lat,lon] for lon,lat in pycones_buffer.boundary.coords]
map.line(locations= buffer_coords)
with fiona.open('/tmp/tweets.shp','r') as source:
    for f in source:
        geometry = shape(f['geometry'])
        color = 'red' if pycones_buffer.intersects(geometry) else 'blue'
        x,y = f['geometry']['coordinates']
        map.simple_marker([y,x], marker_color=color,
                          popup=f['properties']['body'])
map

Other libraries
From major Open Source desktop GIS projects:
That's all folks!
Thanks! Questions?
- Pedro-Juan Ferrer · @vehrka
- Jorge Sanz - @xurxosanz
- Geoinquietos Valencia - @geoinquietosvlc
Slides and repo