%pylab inline
from IPython.display import Image
Populating the interactive namespace from numpy and matplotlib
Section 1.6.3 Projections (and HEALPix)
The problem we have is that we have printers and screens that are flat, but our sky is a sphere. So we need to have some way to transform one to the other. In small areas of sky it does not matter which projection you use, as long as the center of the projection is at center of the image! So unless you are interested in visualizing areas of the sky that get close to or exceed a radian, you are allowed to not worry about this very much.
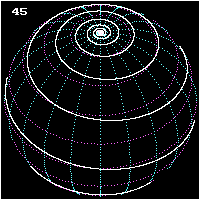
Figure 1.13 is WRONG! Or, I'd prefer to say the accompanying text is wrong. The Mercator projection was made for sailors so that they could sail at a compass setting (SWbS, say) and follow a straight line on the map. This is a very silly constraint for anyone but a sailor (and indeed, pretty silly for a sailor today), but if you have a map like this it needs to be infinitely tall; do the thought experiment of sailing, say, northwest forever, and you will see that you circmunavigate the pole in ever-tightening spirals:
Image(url='http://upload.wikimedia.org/wikipedia/commons/0/02/Loxodrome-2.gif')
Image(url='http://upload.wikimedia.org/wikipedia/commons/f/f4/Mercator_projection_SW.jpg')

The above image is actually a finite slice of an infintely tall cylinder that gives a whole lot of space to the folks at Soute Pole Station. But no one uses Mercator really for anything anymore. The equirectangular (cartesian, as it is often called) projection is one that is used in astronomy often. And that is what Figure 1.13 is actually showing:
"""
NOT THE Mercator Projection
-------------------
Figure1.13.

The Mercator projection. Shown are the projections of circles of constant
radius 10 degrees across the sky. Note that the area is not preserved by the
Mercator projection: the projection increases the size of finite regions on
the sphere, with a magnitude which increases at high latitudes.
"""
# Author: Jake VanderPlas
# Hacked up by Josh
# License: BSD
#   The figure produced by this code is published in the textbook
#   "Statistics, Data Mining, and Machine Learning in Astronomy" (2013)
#   For more information, see http://astroML.github.com
#   To report a bug or issue, use the following forum:
#    https://groups.google.com/forum/#!forum/astroml-general
import numpy as np
from matplotlib import pyplot as plt
from astroML.plotting import plot_tissot_ellipse

#----------------------------------------------------------------------
# This function adjusts matplotlib settings for a uniform feel in the textbook.
# Note that with usetex=True, fonts are rendered with LaTeX.  This may
# result in an error if LaTeX is not installed on your system.  In that case,
# you can set usetex to False.
from astroML.plotting import setup_text_plots
setup_text_plots(fontsize=8, usetex=False)


#------------------------------------------------------------
# generate a latitude/longitude grid
circ_long = np.linspace(-np.pi, np.pi, 13)[1:-1]
circ_lat = np.linspace(-np.pi / 2, np.pi / 2, 7)[1:-1]
radius = 10 * np.pi / 180.


#------------------------------------------------------------
# plot Mercator projection: we need to set this up manually
def mercator_axes():
    ax = plt.axes(aspect=1.0)
    ax.set_xticks(np.pi / 6 * np.linspace(-5, 5, 11))
    ax.set_yticks(np.pi / 12 * np.linspace(-5, 5, 11))
    for axy in (ax.xaxis, ax.yaxis):
        axy.set_major_formatter(plt.FuncFormatter(lambda s, a: r'$%i^\circ$'
                                                  % np.round(s * 180 / np.pi)))
    ax.set_xlim(-np.pi, np.pi)
    ax.set_ylim(-np.pi / 2, np.pi / 2)

    return ax

plt.figure(figsize=(5, 3.75))
ax = mercator_axes()
ax.grid(True)
plot_tissot_ellipse(circ_long[:, None], circ_lat, radius,
                    ax=ax, fc='k', alpha=0.3, lw=0)
ax.set_title('Equirectangular/Cartesian projection')

plt.show()

There is also a discussion of various other projections, including the Hammer, Aitoff, and Mollweide projections. A couple take-home points here:
People call projections all sorts of stuff! Wrong names, new names, mixed up names. If it really matters check how alpha and delta project to x and y as in equations 1.5 and 1.6 -- nothing else can be trusted.
Once again, the projection center should be near the object of interest. If you are interested in the plane of the Galaxy the standard egg-shaped projections are fine, but if you are interested in the poles, use something else.
As an example, below is a Figure from Putman, M.E., Peek, J.E.G., Joung, M.R. (2012). Annual Review of Astronomy and Astrophysics, 50, 491-529, comparing the Aitoff projection (top) to the Zenith-Equal-Area projection (bottom). Notice how distorted high-latitude features like "C" and "MS" are. The Aitoff on top is a very bad representation of the clouds, but it is the standard in the field. I tease the great Gurtina Besla from time to time for showing the Magellanic Stream on the bottom, wrapping around the back of this horrific egg shape when that is the focus of her work.
Image(url="http://www.annualreviews.org/na101/home/literatum/publisher/ar/journals/content/astro/2012/astro.2012.50.issue-1/annurev-astro-081811-125612/20120813/images/large/aa500491.f2.jpeg")

If you want to see other kinds of projections the right texts that define how the work in the FITS standard are:
Calabretta, M.R., Greisen, E.W. (2002). Astronomy and Astrophysics, 395, 1077. dx.doi.org/10.1051/0004-6361:20021327
and
Greisen, E.W., Calabretta, M.R. (2002). Astronomy and Astrophysics, 395, 1061. dx.doi.org/10.1051/0004-6361:20021326
This will explain all the three-letter acronyms that are associated with each projection (ZEA, AZP, CAR, etc) and how they all relate to different ways of projecting the sphere. Some of these preserve straight lines, some preserve circles. Some are equal-area. Think about what part of your sky is most important to preserve and remember: there is no panacea -- all projections distort one way or another
Lastly we discuss HEALPix. Oh, HEALPix. First thing to know is HEALPix is not a projection, but rather a pixelization of the sphere. It was developed in astronomy to make calculating the spherical harmonics for the CMBR anisotropies quick (Gorski, K.M., Hivon, E., Banday, A.J., et al. (2004). arXiv. dx.doi.org/10.1086/427976):
Image(url="http://ej.iop.org/images/0004-637X/622/2/759/Full/fg7.gif")

Somehow people have gotten to thinking HEALPix is a panacea for all our spherical woes. It is not. It is a pixelization of this horrific object, a Rhombic Dodecahedron, projected on the sky:
Image(url='http://upload.wikimedia.org/wikipedia/commons/e/ea/Rhombic_Dodecahedron_With_Density_Animation.gif')

Then broken up into 12 x 4^N subregions:
Image(url="http://ej.iop.org/images/0004-637X/622/2/759/Full/fg3.gif")

A big drawback of HEALPix is you have discretized the sphere by factors of 4 in area -- you don't have a sliding pixelization. Also, once you have done this to your data you still need to have a projection. This is really a way to grid your data, but then you need some piece of code to map it out for you, which is now not as simple a problem as it was before. There are situations where it is nice (most of them are spherical harmonics!), but I often find that people jump to using HEALPix 'cause the cool kids use it, even when something like a zenith-equal-area (ZEA) projection would do fine. There are lots of available codes for HEALPix, and they are totally learnable, well documented, and fast. But, like any tool (I'm looking at you, Bayes) it's not the right thing for every situation, even when you are dealing with the whole sky.
--Josh Peek