Sobre
Scikit-learn: Machine Learning in Python
Scikit-learn is a Python module integrating a wide range of state-of-the-art machine learning algorithms for medium-scale supervised and unsupervised problems. This package focuses on bringing machine learning to non-specialists using a general-purpose high-level language. Emphasis is put on ease of use, performance, documentation, and API consistency. It has minimal dependencies and is distributed under the simplified BSD license, encouraging its use in both academic and commercial settings.
- Simple and efficient tools for data mining and data analysis
- Accessible to everybody, and reusable in various contexts
- Built on NumPy, SciPy, and matplotlib
- Open source, commercially usable - BSD license
Documentação
User guide
The main documentation. This contains an in-depth description of all algorithms and how to apply them.
API
The exact API of all functions and classes, as given by the docstrings. The API documents expected types and allowed features for all functions, and all parameters available for the algorithms.
Examples
Exemplo de example
%matplotlib inline
"""
=========================================================
PCA example with Iris Data-set
=========================================================

Principal Component Analysis applied to the Iris dataset.

See `here <http://en.wikipedia.org/wiki/Iris_flower_data_set>`_ for more
information on this dataset.

"""
# Code source: Gael Varoqueux
# License: BSD 3 clause

import numpy as np
import pylab as pl
from mpl_toolkits.mplot3d import Axes3D


from sklearn import decomposition
from sklearn import datasets

np.random.seed(5)

centers = [[1, 1], [-1, -1], [1, -1]]
iris = datasets.load_iris()
X = iris.data
y = iris.target

fig = pl.figure(1, figsize=(12, 9))
pl.clf()
ax = Axes3D(fig, rect=[0, 0, .95, 1], elev=48, azim=134)

pl.cla()
pca = decomposition.PCA(n_components=3)
pca.fit(X)
X = pca.transform(X)

for name, label in [('Setosa', 0), ('Versicolour', 1), ('Virginica', 2)]:
    ax.text3D(X[y == label, 0].mean(),
              X[y == label, 1].mean() + 1.5,
              X[y == label, 2].mean(), name,
              horizontalalignment='center',
              bbox=dict(alpha=.5, edgecolor='w', facecolor='w'))
# Reorder the labels to have colors matching the cluster results
y = np.choose(y, [1, 2, 0]).astype(np.float)
ax.scatter(X[:, 0], X[:, 1], X[:, 2], c=y, cmap=pl.cm.spectral)

x_surf = [X[:, 0].min(), X[:, 0].max(),
          X[:, 0].min(), X[:, 0].max()]
y_surf = [X[:, 0].max(), X[:, 0].max(),
          X[:, 0].min(), X[:, 0].min()]
x_surf = np.array(x_surf)
y_surf = np.array(y_surf)
v0 = pca.transform(pca.components_[0])
v0 /= v0[-1]
v1 = pca.transform(pca.components_[1])
v1 /= v1[-1]

ax.w_xaxis.set_ticklabels([])
ax.w_yaxis.set_ticklabels([])
ax.w_zaxis.set_ticklabels([])

pl.show()

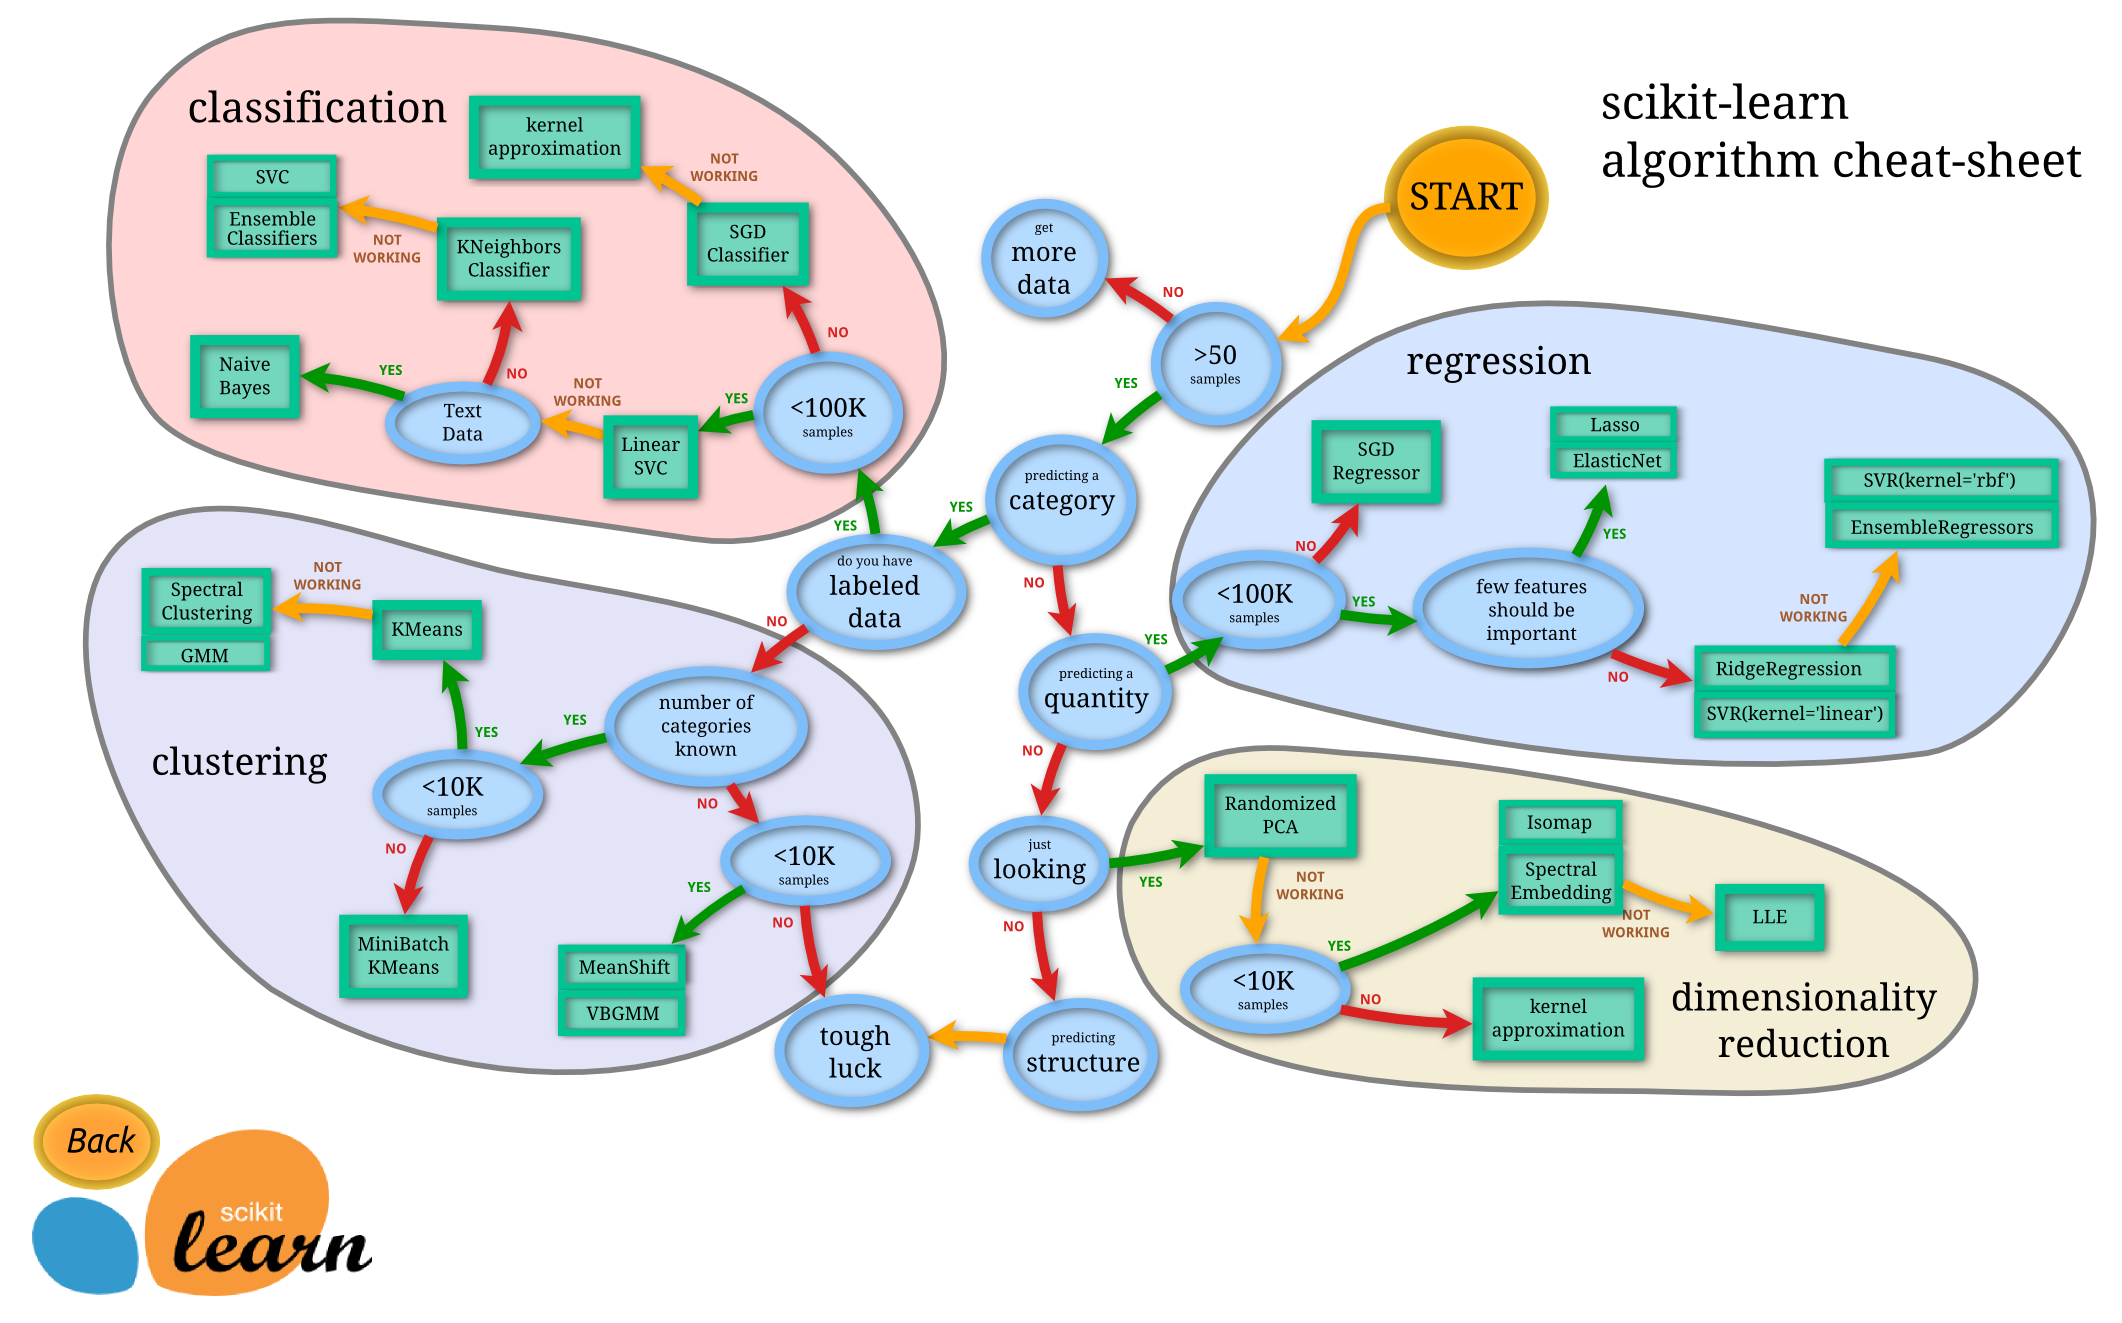
Flow chart
More API
sklearn.cross_validation
- KFold
- ShuffleSplit
- ...
sklearn.datasets
Datasets
- load_iris
- load_boston
- ...
Geradores de dados de dados randômicos
- make_classification : Generate a random n-class classification problem.
- ...
sklearn.feature_extraction
- text.CountVectorizer : Convert a collection of text documents to a matrix of token counts
- ...
sklearn.metrics
- accuracy_score
- confusion_matrix
- mean_squared_error
- ...
sklearn.preprocessing
- OneHotEncoder
- ...