Example Election Maps
This notebook (which is subject to change) provides some early sketches of generating maps that can be used to support election reporting for the UK General Election 2015.
#!pip3 install --upgrade folium
#Use the latest version of folium pulled directly from github
!pip3 install --upgrade  git+git://github.com/python-visualization/folium
I'm going to work in pandas wherever possible and use the folium package (which employs the leaflet library) to support the mapping.
import pandas as pd
import folium
from IPython.display import HTML
I've found folium's notebook support to be flakey at time. This approach from the early days of folium still seems robust?
def inline_map(map):
"""
Embeds the HTML source of the map directly into the IPython notebook.
This method will not work if the map depends on any files (json data). Also this uses
the HTML5 srcdoc attribute, which may not be supported in all browsers.
"""
map._build_map()
return HTML('<iframe srcdoc="{srcdoc}" style="width: 100%; height: 510px; border: none"></iframe>'.format(srcdoc=map.HTML.replace('"', '"')))
def embed_map(map, path="map.html"):
"""
Embeds a linked iframe to the map into the IPython notebook.
Note: this method will not capture the source of the map into the notebook.
This method should work for all maps (as long as they use relative urls).
"""
map.create_map(path=path)
return HTML('<iframe src="files/{path}" style="width: 100%; height: 510px; border: none"></iframe>'.format(path=path))
Electoral Boundaries - Shapefiles
Martin Chorley has collected together a range of useful shapefiles in geojson and TopoJSON formats that describe various electoral boundaries (martinjc/UK-GeoJSON).
import requests
url='https://github.com/martinjc/UK-GeoJSON/blob/master/json/electoral/gb/wpc.json?raw=true'
r = requests.get(url)
with open("data/wpc.json", "wb") as code:
    code.write(r.content)
r=None
Chris Hanretty et al. are making election forecasts based on aggregated poll data available at electionforecast.co.uk.
We can grab the data into a data frame.
df=pd.read_html('http://www.electionforecast.co.uk/tables/predicted_probability_by_seat.html')
df[0][:10]
| Conservatives | Labour | Liberal Democrats | SNP | Plaid Cymru | Greens | UKIP | Other | Seat | Region | 2010 | |
|---|---|---|---|---|---|---|---|---|---|---|---|
| 0 | 0 | 100 | 0 | 0 | 0 | 0 | 0 | 0 | Aberavon | Wales | Labour |
| 1 | 95 | 5 | 0 | 0 | 0 | 0 | 0 | 0 | Aberconwy | Wales | Conservatives |
| 2 | 0 | 51 | 0 | 48 | 0 | 0 | 0 | 0 | Aberdeen North | Scotland | Labour |
| 3 | 2 | 55 | 1 | 42 | 0 | 0 | 0 | 0 | Aberdeen South | Scotland | Labour |
| 4 | 16 | 0 | 5 | 80 | 0 | 0 | 0 | 0 | West Aberdeenshire and Kincardine | Scotland | Liberal Democrats |
| 5 | 0 | 38 | 0 | 62 | 0 | 0 | 0 | 0 | Airdrie and Shotts | Scotland | Labour |
| 6 | 100 | 0 | 0 | 0 | 0 | 0 | 0 | 0 | Aldershot | South East | Conservatives |
| 7 | 100 | 0 | 0 | 0 | 0 | 0 | 0 | 0 | Aldridge-Brownhills | West Midlands | Conservatives |
| 8 | 100 | 0 | 0 | 0 | 0 | 0 | 0 | 0 | Altrincham and Sale West | North West | Conservatives |
| 9 | 1 | 99 | 0 | 0 | 0 | 0 | 0 | 0 | Alyn and Deeside | Wales | Labour |
#If necessary, grab a local copy... (really should add a timestamp to the filename...)
df[0].to_csv('data/pred.csv',index=False)
tmp=pd.DataFrame({'val':[100],'const':['Aldershot']})
tmp
| const | val | |
|---|---|---|
| 0 | Aldershot | 100 |
!head data/pred.csv
Conservatives,Labour,Liberal Democrats,SNP,Plaid Cymru,Greens,UKIP,Other,Seat,Region,2010
0,100,0,0,0,0,0,0,Aberavon,Wales,Labour
94,6,0,0,0,0,0,0,Aberconwy,Wales,Conservatives
0,41,0,59,0,0,0,0,Aberdeen North,Scotland,Labour
2,63,1,35,0,0,0,0,Aberdeen South,Scotland,Labour
8,0,18,74,0,0,0,0,West Aberdeenshire and Kincardine,Scotland,Liberal Democrats
0,18,0,82,0,0,0,0,Airdrie and Shotts,Scotland,Labour
100,0,0,0,0,0,0,0,Aldershot,South East,Conservatives
100,0,0,0,0,0,0,0,Aldridge-Brownhills,West Midlands,Conservatives
100,0,0,0,0,0,0,0,Altrincham and Sale West,North West,Conservatives
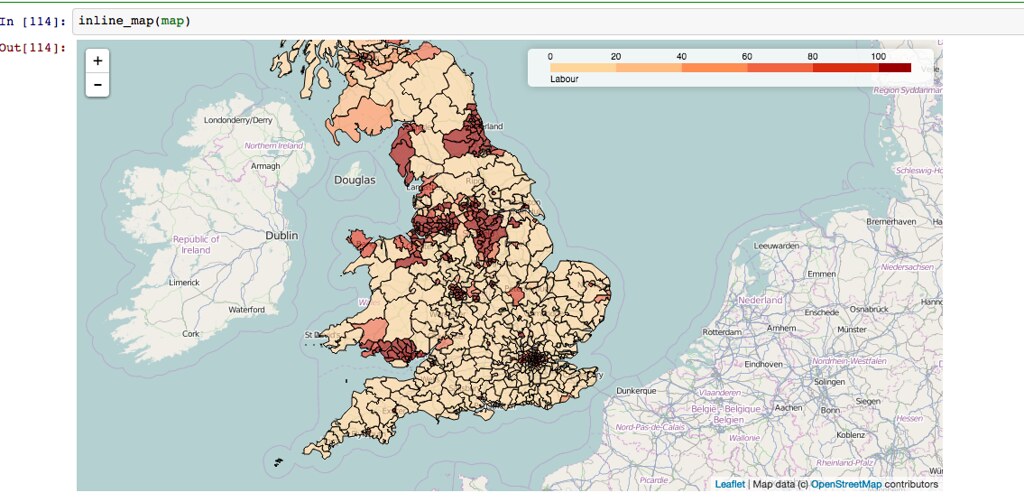
Simple Mapping
We can use a choropleth map to display the forecast percentage for a particular party.
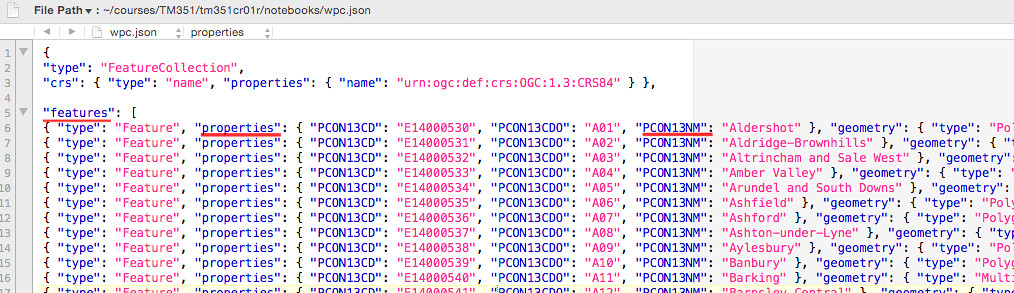
The folium map object will accept a path to a geojson file, associating each polygon with a key value into the geojson object specified in the key-on parameter.
In this case we want to match on Westminster Parliamentary constituency names as described in the seat column of the electionforecast data. Inspection of the the geojson file shows that the seat name is available as a key value along the path feature.properties.PCON13NM.
//example image screenshot (maps won't work in previewer...)
map = folium.Map(location=[53, 0],zoom_start=6)
map.geo_json(geo_path='wpc.json', data=df[0],data_out='data.json', columns=['Seat', 'Labour'],
             key_on='feature.properties.PCON13NM',threshold_scale=[0, 20, 40, 60, 80, 100],
             fill_color='OrRd')
embed_map(map)
inline_map(map)
Who's the Favourite?
We can find the favourite party for each seat by transforming the electionforecast data to a long format, grouping by seat, sorting in a descending order the parties by forecast value and then picking the first in each group.
wpc_long=pd.melt(df[0],id_vars=['Seat','Region','2010'])
#http://stackoverflow.com/a/19818942
wpc_favourite=wpc_long.sort('value', ascending=False).groupby('Seat', as_index=False).first()
wpc_favourite[:3]
| Seat | Region | 2010 | variable | value | |
|---|---|---|---|---|---|
| 0 | Aberavon | Wales | Labour | Labour | 100 |
| 1 | Aberconwy | Wales | Conservatives | Conservatives | 95 |
| 2 | Aberdeen North | Scotland | Labour | Labour | 51 |
wpc_favourite[ wpc_favourite['Seat']=='Isle of Wight' ]
| Seat | Region | 2010 | variable | value | |
|---|---|---|---|---|---|
| 291 | Isle of Wight | South East | Conservatives | Conservatives | 100 |
How's the Betting?
As well as the electionforecast predictions, we can also look to see what the betting markets predict. The tellmetheodds site is currently running a prediction showing the likelihood of Labour or the Conservatives winning the largest number of seats. This site looks like it could be an output of Swansea University's AHRC funded 'What are the odds? Capturing and exploring data created by online political gambling markets' project?
I can't find the data collected as part of that project anywhere obvious, so in an unfunded act I threw together a quick daily scraper of election betting odds offered by a variety of bookmakers on a per-seat basis grabbed once a day from oddschecker (if they can scrape, so can I...;-). You can find it here: UK general election 2015 daily seat odds scraper on morhp.io.
So for example, I can run commands like:
SELECT * FROM 'IW2015GE' iw, (SELECT MAX(time) AS maxt FROM 'IW2015GE' LIMIT 1) WHERE time=maxt GROUP BY bookie
against the morph.io SQLite API to pull back the latest odds for the Isle of Wight constituency grouped by bookie.
Or I can download the complete database and plot the time series evolution of the odds being ofference for different parties by different bookmakers for different seats over time.
One things I was wondering whether I'd be able to run automatic breakout detection scripts over all the separate candidates/parties in each constituency once a day to see wheteher there were any step changes which could perhaps signal local news...
I'll try to put together some demos of using the betting data in the next couple of weeks...