Choosing Colors for Scientific Visualization in Matplotlib
In [1]:
# Using Canopy 1.4
# matplotlib version 1.3.1
from IPython.core import display
from IPython.html.widgets import interact, interactive, fixed
from IPython.html import widgets

import numpy as np
from io import BytesIO
import PIL
import PIL.Image
import PIL.ImageDraw

import matplotlib
matplotlib.rc('text', usetex=False)
import matplotlib.pyplot as plt
import matplotlib.colors as col
import matplotlib.cm as cm
import matplotlib.patches as mpatches
plt.rc('lines', linewidth=2)

import colormath
if int(colormath.VERSION.split(".")[0]) < 2:
    print "You need the latest version of colormath."
    print "Possibly, you'll have to install it with"
    print "    ! pip install --upgrade colormap"
else:
    from colormath.color_objects import sRGBColor, LCHabColor, LabColor, HSVColor
    from colormath.color_conversions import convert_color
Color Models
In [2]:
def rgb_to_device_gray(r,g,b):
    """ Given RGB values in [0,1], return the grayscale value in the Postscript
        DeviceGray model, in [0,1]
    """
    return 0.3*r + 0.59*g + 0.11*b


def rgb_to_lightness(r,g,b):
    """ Given RGB values in [0,1], return the CIELAB model lightness,
        in [0,1]
    """
    return convert_color(sRGBColor(r, g, b), LabColor).lab_l


def rgb_to_hsv_value(r, g, b):
    """ Given RGB values in [0,1], return the HSV "value",
        in [0,1]
    """
    return convert_color(sRGBColor(r, g, b), HSVColor).hsv_v

def rgb_to_lab(r,g,b):
    """ Given RGB values in [0,1], return a tuple (l,a,b) of lightness, a
        value, and b value and hue, in [0:1, 0:1, 0:1]
    """
    cielab = convert_color(sRGBColor(r, g, b), LabColor)
    return (cielab.lab_l, cielab.lab_a, cielab.lab_b)


def lab_to_rgb(l, a, b, clip=True):
    rgb = convert_color(LabColor(l, a, b), sRGBColor)
    r, g, b = rgb.rgb_r, rgb.rgb_g, rgb.rgb_b
    if r > 1.0:
        if not clip: raise ValueError("Clipping in r")
        r = 1.0
    if r < 0.0:
        if not clip: raise ValueError("Clipping in r")
        r = 0.0
    if g > 1.0:
        if not clip: raise ValueError("Clipping in g")
        g = 1.0
    if g < 0.0:
        if not clip: raise ValueError("Clipping in g")
        g = 0.0
    if b > 1.0:
        if not clip: raise ValueError("Clipping in b")
        b = 1.0
    if b < 0.0:
        if not clip: raise ValueError("Clipping in b")
        b = 0.0
    return (r, g, b)


def rgb_to_lch(r,g,b):
    """ Given RGB values in [0,1], return a tuple (l,c,h) of lightness, chroma,
        and hue, in [0:100, 0:100*, 0:360]. Note that the chroma value might go
        above 100%
    """
    lch = convert_color(sRGBColor(r, g, b), LCHabColor)
    l, c, h = lch.lch_l, lch.lch_c, lch.lch_h
    if l > 100.0: l = 100.0
    if l < 0.0  : l = 0.0
    if c < 0.0  : c = 0.0
    # while in principle, chroma has a maximum value of 100,
    # we can have "super-chromatic colors" without too many problems
    while h > 360.0:
        h = h - 360.0
    while h < 0.0:
        h = h + 360
    return(l, c, h)


def rgb_to_hsv(r,g,b):
    """ Given RGB values in [0,1], return a tuple (h,s,v) of hue, saturation
       (~chroma) and value (~lightness), in [0:360, 0:100, 0:100]
    """
    hsv = convert_color(sRGBColor(r, g, b), HSVColor)
    h, s, v = hsv.hsv_h, hsv.hsv_s, hsv.hsv_v
    return(h, s, v)


def lch_to_rgb(l, c, h, clip=True):
    """ Inverse of rgb_to_lch
    """
    rgb = convert_color(LCHabColor(l, c, h), sRGBColor)
    r, g, b = rgb.rgb_r, rgb.rgb_g, rgb.rgb_b
    if r > 1.0:
        if not clip: raise ValueError("Clipping in r")
        r = 1.0
    if r < 0.0:
        if not clip: raise ValueError("Clipping in r")
        r = 0.0
    if g > 1.0:
        if not clip: raise ValueError("Clipping in g")
        g = 1.0
    if g < 0.0:
        if not clip: raise ValueError("Clipping in g")
        g = 0.0
    if b > 1.0:
        if not clip: raise ValueError("Clipping in b")
        b = 1.0
    if b < 0.0:
        if not clip: raise ValueError("Clipping in b")
        b = 0.0
    return(r, g, b)


def hsv_to_rgb(h, s, v, clip=True):
    """ Inverse of rgb_to_lch
    """
    rgb = convert_color(HSVColor(h, s, v), sRGBColor)
    r, g, b = rgb.rgb_r, rgb.rgb_g, rgb.rgb_b
    if r > 1.0:
        if not clip: raise ValueError("Clipping in r")
        r = 1.0
    if r < 0.0:
        if not clip: raise ValueError("Clipping in r")
        r = 0.0
    if g > 1.0:
        if not clip: raise ValueError("Clipping in g")
        g = 1.0
    if g < 0.0:
        if not clip: raise ValueError("Clipping in g")
        g = 0.0
    if b > 1.0:
        if not clip: raise ValueError("Clipping in b")
        b = 1.0
    if b < 0.0:
        if not clip: raise ValueError("Clipping in b")
        b = 0.0
    return(r, g, b)
In [3]:
def show_pil_image(im):
    b = BytesIO()
    im.save(b, format='png')
    data = b.getvalue()
    display.display(display.Image(data=data, format='png', embed=True))
In [4]:
def show_rgb(r,g,b, is_upscaled=False):
    if not is_upscaled:
        r = int(r * 255.0)
        g = int(g * 255.0)
        b = int(b * 255.0)
    else:
        r = int(r)
        g = int(g)
        b = int(b)
    img = PIL.Image.new("RGBA", (100, 100)) # NOTE: may not be sRGB!
    draw = PIL.ImageDraw.Draw(img)
    draw.rectangle(((0,0), (100, 100)), fill=(r,g,b))
    show_pil_image(img)
In [5]:
show_rgb(221, 144, 167, is_upscaled=True) # Colorpicker matches expected sRGB values

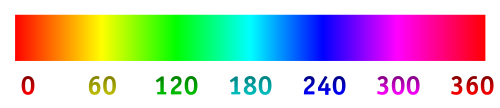
The LCH Color Model
Hue in LCH is rotated by 40 degrees with respect to hue in HSV, which looks like this:
In [6]:
def plot_lch_by_hue(hue, c_max=150, nc=16, nl=11, markersize=500, adjust_hue=True):
    if adjust_hue:
        hue = hue + 40.0
    ax = plt.subplot(111)
    ax.set_aspect('equal')
    x = []
    y = []
    colors = []
    for c in np.linspace(0, c_max, nc):
        for l in np.linspace(0, 100.0, nl):
            try:
                r, g, b = lch_to_rgb(l, c, hue, clip=False)
                x.append(c)
                y.append(l)
                colors.append((r,g,b))
            except ValueError:
                pass # skip values that can't be plotted
    ax.scatter(x, y, c=colors, marker='s', s=markersize, linewidth=0)
    ax.set_ylabel("lightness")
    ax.set_xlabel("chroma")
    imgdata = BytesIO()
    plt.savefig(imgdata, format='png')
    plt.close()
    imgdata.seek(0)
    display.display(display.Image(imgdata.read(), format='png', embed=True))


def plot_lch_by_lightness(lightness, c_max=120, nc=16, nh=36):
    plt.gcf().set_size_inches(6,6)
    rad = []
    theta = []
    colors = []
    # LCH plot
    ax = plt.subplot(111, polar=True)
    ax.grid(True)
    for c in np.linspace(0, c_max, nc):
        for h in np.linspace(0, 360, nh, endpoint=False):
            try:
                r, g, b = lch_to_rgb(lightness, c, h, clip=False)
                theta.append(((h-40) / 360.0) * 2 * np.pi)
                rad.append(c)
                colors.append((r,g,b))
            except ValueError:
                pass # skip values that can't be plotted
    plt.scatter(theta, rad, c=colors, s=100, linewidth=0)
    ax.set_yticks([50, 100, c_max])
    ax.set_yticklabels(['', '100', str(c_max)])
    ax.set_xticks(np.linspace(0, 2*np.pi,17))
    ax.set_xticklabels([u"40\u00b0", ''])
    ax.set_rmax(140)
    imgdata = BytesIO()
    plt.savefig(imgdata, format='png')
    plt.close()
    imgdata.seek(0)
    display.display(display.Image(imgdata.read(), format='png', embed=True))
In [7]:
plot_lch_by_hue(hue=0, adjust_hue=False)

In [8]:
plot_lch_by_lightness(lightness=60)

Color Palettes for "nominal data" (line graphics)
In [9]:
def plot_color_array(colors, background='white', inch_per_square=0.5):
    """ Given an array of (r,g,b) tuples, show an array of squares in those colors """
    ax = plt.subplot(111)
    rows = 6
    cols = len(colors)
    light_yzero = -rows + 2.0
    lightness = np.zeros(cols)
    hsv_value = np.zeros(cols)
    x = np.linspace(0.5, float(cols-1)+0.5, num=cols)
    plt.gcf().set_size_inches(cols*inch_per_square,rows*inch_per_square)
    rect = mpatches.Rectangle((-0.5, -1.5), cols+1, 4, color=background)
    plt.gca().add_patch(rect)
    for i, color in enumerate(colors):
        # proper color square
        pos = np.array([i, 0])
        rect = mpatches.Rectangle(pos, 0.9,0.9, color=color)
        plt.gca().add_patch(rect)
        # lightness color square
        pos = np.array([i, -1])
        v = rgb_to_lightness(*color) / 100.0
        lightness[i] = v
        v = rgb_to_hsv_value(*color)
        hsv_value[i] = v
        rect = mpatches.Rectangle(pos, 0.9,0.9, color=str(lightness[i]))
        plt.gca().add_patch(rect)
    ax.plot(x, np.zeros(cols)+light_yzero, ls='--', color='gray')
    ax.plot(x, np.zeros(cols)+light_yzero+1.0, ls='--', color='gray')
    ax.plot(x, np.zeros(cols)+light_yzero+2.0, ls='--', color='gray')
    ax.plot(x, 2.0*lightness+light_yzero, marker='o', color='black')
    ax.plot(x, 2.0*hsv_value+light_yzero, marker='D', color="#3556A7")
    ax.text(-3.3, 0.4, 'color')
    ax.text(-3.3, -0.6, 'grayscale')
    ax.text(-3.3, -2.6, 'HSV value', color='#3556A7')
    ax.text(-3.3, -3.4, 'lightness')
    ax.set_xlim(-3.3, cols+0.5)
    ax.set_ylim(-rows+1, 1.5)
    plt.axis('off')
    imgdata = BytesIO()
    plt.savefig(imgdata, format='png')
    plt.close()
    imgdata.seek(0)
    display.display(display.Image(imgdata.read(), format='png', embed=True))
In [10]:
def plot_polar_lch(colors):
    plt.gcf().set_size_inches(8,4)
    rad = np.zeros(len(colors))
    theta = np.zeros(len(colors))
    # LCH plot
    ax = plt.subplot(121, polar=True)
    ax.set_title("LCH - hue vs chroma")
    ax.grid(True)
    for i, color in enumerate(colors):
        r,g,b = color
        l, c, h = rgb_to_lch(r,g,b)
        rad[i] = c
        theta[i] = ((h-40) / 360.0) * 2 * np.pi
    plt.scatter(theta, rad, c=colors, s=100, linewidth=0)
    ax.set_yticks([50, 100, 140])
    ax.set_yticklabels(['', '100', '140'])
    ax.set_xticklabels([u"40\u00b0", ''])
    ax.set_rmax(140)
    # HSV plot
    ax = plt.subplot(122, polar=True)
    ax.set_title("HSV - hue vs saturation")
    ax.grid(True)
    for i, color in enumerate(colors):
        r,g,b = color
        h, s, v = rgb_to_hsv(r,g,b)
        rad[i] = s
        theta[i] = (h / 360.0) * 2 * np.pi
    plt.scatter(theta, rad, c=colors, s=100, linewidth=0)
    ax.set_yticks([0.5, 1.0, 1.4])
    ax.set_yticklabels(['', '1.0', ' 1.4'])
    ax.set_xticklabels([u"0\u00b0", ''])
    ax.set_rmax(1.4)
    imgdata = BytesIO()
    plt.savefig(imgdata, format='png')
    plt.close()
    imgdata.seek(0)
    display.display(display.Image(imgdata.read(), format='png', embed=True))
In [11]:
def shift_lightness(colors, shift):
    """ For every (r,g,b) tuple in colors, shift the lightness value by the specified amount """
    result = []
    for (r, g, b) in colors:
        l, a, b = rgb_to_lab(r, g, b)
        l += shift
        if l > 100.0:
            l = 100.0
        if l < 0.0:
            l = 0.0
        result.append(lab_to_rgb(l, a, b))
    return result
A Brewer-inspired color scheme
The following color scheme borrows from the Colorbrewer "Paired" scheme, with some minor tweaks
In [12]:
def my_colors():
    color_names = [
        "white", "black", "red", "blue", "orange","green", "purple",
        "brown", "pink", "yellow", "lightred", "lightblue", "lightorange",
        "lightgreen", "lightpurple", "grey"]
    rgb_values = {
    "white"        : (255, 255, 255),
    "black"        : (0, 0, 0),
    "red"          : (228, 26, 28),
    "blue"         : (55, 126, 184),
    "orange"       : (255, 127, 0),
    "green"        : (77, 175, 74),
    "purple"       : (152, 78, 163),
    "brown"        : (166, 86, 40),
    "pink"         : (247, 129, 191),
    "yellow"       : (210, 210, 21),
    "lightred"     : (251, 154, 153),
    "lightblue"    : (166, 206, 227),
    "lightorange"  : (253, 191, 111),
    "lightgreen"   : (178, 223, 138),
    "lightpurple"  : (202, 178, 214),
    "grey"         : (153, 153, 153),
    }
    colors = []
    for color_name in color_names:
        colors.append(np.array(rgb_values[color_name], dtype=np.float64)/255.0)
    return colors
In [13]:
print my_colors()
[array([ 1., 1., 1.]), array([ 0., 0., 0.]), array([ 0.89411765, 0.10196078, 0.10980392]), array([ 0.21568627, 0.49411765, 0.72156863]), array([ 1. , 0.49803922, 0. ]), array([ 0.30196078, 0.68627451, 0.29019608]), array([ 0.59607843, 0.30588235, 0.63921569]), array([ 0.65098039, 0.3372549 , 0.15686275]), array([ 0.96862745, 0.50588235, 0.74901961]), array([ 0.82352941, 0.82352941, 0.08235294]), array([ 0.98431373, 0.60392157, 0.6 ]), array([ 0.65098039, 0.80784314, 0.89019608]), array([ 0.99215686, 0.74901961, 0.43529412]), array([ 0.69803922, 0.8745098 , 0.54117647]), array([ 0.79215686, 0.69803922, 0.83921569]), array([ 0.6, 0.6, 0.6])]
In [14]:
def shifted_plotter(shift):
    plot_color_array(shift_lightness(my_colors(), shift))
    plot_polar_lch(my_colors())
#interact(shifted_plotter, shift=[-100,100])
shifted_plotter(0)


For any plots below, we use the defined color scheme
In [15]:
plt.rc('axes', color_cycle=shift_lightness(my_colors(), 0.0)[2:])
Built-In colormaps
In [16]:
def show_cmaps(names=None, height=10, gray=False):
    """Display all colormaps included in the names list. If names is None, all
       defined colormaps will be shown

       height is the total height of generated plot (in inches?)

       If gray is given as True, show a grayscale image
    """
    # base code from http://www.scipy.org/Cookbook/Matplotlib/Show_colormaps
    a = np.outer(np.arange(0,1,0.01),np.ones(10)) # pseudo image data
    f=plt.figure(figsize=(height,5))
    f.subplots_adjust(top=0.8,bottom=0.05,left=0.01,right=0.99)
    # get list of all colormap names
    # this only obtains names of built-in colormaps:
    maps=[m for m in cm.datad if not m.endswith("_r")]
    # use undocumented cmap_d dictionary instead
    if names is None:
        maps = [m for m in cm.cmap_d if not m.endswith("_r")]
        maps.sort()
        names = maps
    else:
        maps = cm.cmap_d.keys()
    # determine number of subplots to make
    l=len(maps)+1
    if names is not None: l=len(names)  # assume all names are correct!
    # loop over maps and plot the selected ones
    i=0
    for name in names:
        if name in maps:
            i+=1
            ax = plt.subplot(1,l,i)
            ax.axis("off")
            plt.imshow(a,aspect='auto',cmap=cm.get_cmap(name),origin="lower")
            plt.title(name,rotation=90,fontsize=10,verticalalignment='bottom')
    imgdata = BytesIO()
    plt.savefig(imgdata, format='png')
    plt.close()
    imgdata.seek(0)
    if gray:
        im = PIL.Image.open(imgdata).convert('LA').rotate(-90)
    else:
        im = PIL.Image.open(imgdata).rotate(-90)
    imgdata = BytesIO()
    im.save(imgdata, format='png')
    display.display(display.Image(imgdata.getvalue(), format='png', embed=True))
In [17]:
show_cmaps()

Seqential and Divergent Colormaps
"Lightness" is defined in the CIELAB color model, and represents the visual perception of a color's brightness.
As the "grayscale value", we use the formula specified in the Postscript standard for the conversion between the color models DeviceRGB and DeviceGray:
Presumably, this is what a black-and-white postscript printer would produce when a colored plot is printed (although, from my tests the results seem to be closer to the lightness).
In [18]:
def rgb(vals, colormap):
    """ Given a numpy array of vals in [0,1], and the name of a colormap,
        return a 2 dimensional numpy array, such that [i,0:2] are the RGB
        values associated with vals[i]. The RGB values are given in [0,1]
    """
    cmap = cm.get_cmap(colormap)
    result = np.zeros(shape=(len(vals),3))
    for i, val in enumerate(vals):
        result[i] = np.array(cmap(val)[:-1])
    return result


def lightness(vals, colormap):
    """ Given a numpy array of vals in [0,1], and the name of a colarmap,
        return a numpy array of lightness values in the CIELAB model associated
        with vals, in [0,100]
    """
    rgb_vals = rgb(vals, colormap)
    result = np.zeros(len(vals))
    for i, data in enumerate(rgb_vals):
        r, g, b = data
        result[i] = rgb_to_lightness(r, g, b)
    return result


def device_gray(vals, colormap):
    """ Given a numpy array of vals in [0,1], and the name of a colarmap,
        return a numpy array of grayscale values in the Postcript DeviceGray
        model associated with vals, in [0,100]
    """
    n = len(vals)
    cmap = cm.get_cmap(colormap)
    result = np.zeros(n)
    for i, val in enumerate(vals):
        r, g, b, a = cmap(val)
        result[i] = rgb_to_device_gray(r,g,b) * 100
    return result


def plot_characteristics(vals, colormaps, quantity, type='sequential',
    title=None):
    """ Given an array of vals, a list  of colormap names, and a "quantity"
        function (either device_gray or ligthness), generate a plot showing
        that quantity over the values.

        If show_linear is True, plot the linear curve y = 100*x for comparison.

        If show_center is True, plot a vertical line at the value 0.5

        If title is given, use as the title for the generated plot
    """
    fig = plt.figure()
    ax = plt.subplot(111)
    if title is not None:
        ax.set_title(title)
    if type == 'sequential':
        ax.plot(vals, vals*100.0, '--', color='black', label='')
    elif type == 'divergent':
        ax.plot(vals, vals*200.0,      '--', color='black', label='')
        ax.plot(vals, -vals*200.0+200, '--', color='black', label='')
    else:
        raise ValueError('type must be "sequential" or "divergent"')
    for colormap in colormaps:
        ax.plot(vals, quantity(vals, colormap), label=colormap)
    ax.set_ylim([0,100])
    box = ax.get_position()
    ax.set_position([box.x0, box.y0, box.width * 0.8, box.height])
    ax.legend(loc='center left', bbox_to_anchor=(1, 0.5))
    imgdata = BytesIO()
    plt.savefig(imgdata, format='png')
    plt.close()
    imgdata.seek(0)
    display.display(display.Image(imgdata.getvalue(), format='png', embed=True))


def strictly_increasing(L):
    """ Given a list L, return True iff the values in L are strictly
        monotonicly increasing
    """
    return all(x<y for x, y in zip(L, L[1:]))


def check_monotonic_lightness(colormap, half=False):
    """ Given then mae of a color map, return True if the lightness for the
        colormap is monotonically increasing

        If half is given as True, only check values up to 0.5
    """
    if half:
        x = np.linspace(0,0.5,50)
    else:
        x = np.linspace(0,1.0,50)
    return strictly_increasing(lightness(x, colormap))
Selection of sequential colormaps
In [19]:
seq_list = ['cubehelix', 'gnuplot2', 'gist_heat', 'afmhot', 'hot']
In [20]:
show_cmaps(seq_list, height=len(seq_list)*0.2)
show_cmaps(seq_list, height=len(seq_list)*0.2, gray=True)


In [21]:
plot_characteristics(np.linspace(0,1,50), seq_list,
                    lightness, 'sequential', title="Lightness")

In [22]:
for colormap in ['cubehelix', 'gist_heat', 'gnuplot2', 'afmhot']:
    print "%s: %s" % (colormap, check_monotonic_lightness(colormap))
cubehelix: True
gist_heat: True
gnuplot2: True
afmhot: True
Selection of divergent colormaps
In [23]:
div_list = ['RdBu', 'seismic', 'bwr', 'coolwarm', 'RdYlBu']
In [24]:
show_cmaps(div_list, height=len(seq_list)*0.2)
show_cmaps(div_list, height=len(seq_list)*0.2, gray=True)


In [25]:
plot_characteristics(np.linspace(0,1,50), div_list,
                    lightness, 'divergent', title="Lightness")

In [26]:
for colormap in ['seismic', 'bwr', 'coolwarm', 'RdBu']:
    print "%s: %s" % (colormap, check_monotonic_lightness(colormap, half=True))
seismic: True
bwr: True
coolwarm: True
RdBu: True