Data Science con Python
(o un breve raconto de las libs para laburar con datos)
¿Quién les habla?
de iure:
- Lic. en Bioquímica.
- Doctorando en Ciencias Biológicas (escribiendo... una tesis inmunológica).
de facto:
- Desarrollador Python/JS (ponele...).
- Científico de Datos (ponele...).
- Analista Cuantitativo en Finanzas (ponele...)
Curioso...
[damianavila](https://github.com/damianavila)
[@damian_avila](http://twitter.com/damian_avila)
[www.damian.oquanta.info](http://www.damian.oquanta.info)
¿Qué hace un científico?
- Observa
- Genera una hipótesis sobre el/los fenómeno/s observado/s
- Diseña y realiza un experimento (o una simulación) para testear la hipótesis
- Obtiene datos del experimento (o la simulación)
- Procesa y visualiza los datos obtenidos
- Propone un modelo para explicar los datos procesados
- Genera predicciones a partir del modelo propuesto
- Contrasta (valida) las predicciones con los datos experimentales (o simulados)
- Comunica la hipótesis, los resultados obtenidos y el modelo propuesto
The Cross Industry Standard Process for Data Mining
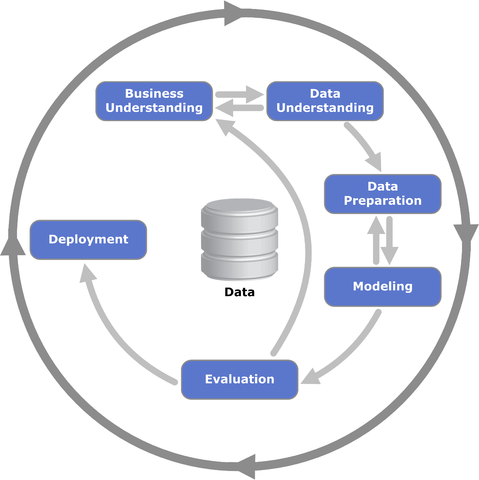
Data Science Workflow

¿Qué necesita un científico de datos?
- Un lenguaje fácil de aprender.
- Un lenguaje versátil en su utilización.
- Un lenguaje con una sintaxis simple y de alto nivel.
- Una colección de herramientas para el tratamiento de datos.
- Múltiples opciones para la visualización de datos.
- Un "entorno" unificado e interactivo.
Python
- Un lenguaje fácil de aprender.
- Un lenguaje con una sintaxis simple y de alto nivel.
- Un lenguaje versátil en su utilización.
y las baterías adicionales...
- Una colección de herramientas para el tratamiento de datos.
Bajo nivel...
- Numpy, objetos tipo arreglos y rutinas para manipularlos.
- Python tiene listas, enteros, punto flotante, etc. Para cálculo numérico necesitamos más... allí aparece Numpy.
- Numpy es un paquete que provee a Python con arreglos multidimensionales de alta eficiencia y diseñados para cálculo científico.
- Un array puede contener:
- tiempos discretos de un experimento o simulación.
- señales grabadas por un instrumento de medida.
- pixeles de una imagen, etc.
El objeto arreglo.
- Los arreglos de NumPy son de tipado estático y homogéneo.
- Multidimensionales.
- Son más eficientes en el uso de la memoria. La funciones matemáticas complejas y computacionalmente costosas (pj: la multiplicación de matrices) son implementadas en lenguajes compilados como C o Fortran.
import numpy as np
lista = [1, 2, 3, 4 , 5]
lista
[1, 2, 3, 4, 5]
a = np.array(lista)
a
array([1, 2, 3, 4, 5])
type(a)
numpy.ndarray
a.dtype
dtype('int64')
a.ndim
1
a.shape
(5,)
Indexado y cortes
a = np.arange(10)
a
array([0, 1, 2, 3, 4, 5, 6, 7, 8, 9])
a[0], a[2], a[-1]
(0, 2, 9)
mis_indices = [0, 2, -1]
a[mis_indices]
array([0, 2, 9])
a[2:9]
array([2, 3, 4, 5, 6, 7, 8])
a[2:9:3]
array([2, 5, 8])
a[::2]
array([0, 2, 4, 6, 8])
a[3::2]
array([3, 5, 7, 9])
a[-2:]
array([8, 9])
Copias y Vistas
Plain Python
a = [1, 2, 3]
b = a[:]
b
[1, 2, 3]
b[0] = 100
b
[100, 2, 3]
a
[1, 2, 3]
Numpy
a = np.array([1, 2, 3])
b = a[:]
b
array([1, 2, 3])
b[0] = 100
a
array([100, 2, 3])
¿Qué más tenemos en Numpy?
Operaciones por elementos:
- Escalares
- Aritméticas
- Lógicas
Reducciones básicas:
- Aritmeticas
- Estadísticos
- Lógicas
Broadcasting:
En NumPy es posible hacer operaciones entre arreglos de diferente tamaño a través del broadcasting. NumPy transforma (propaga) los arreglos involucrados para que tengan el mismo tamaño y, por tanto, puedan someterse a las operaciones por elementos sin generar excepciones.
Manipulación de arreglos
I/O
Algebra lineal básica
- Scipy, biblioteca para procesamiento de datos de alto nivel: optimización, regresión, interpolación, etc.
SciPy se desarrolla sobre NumPy y provee de un gran número de algoritmos científicos de alto nivel.
- Functiones especiales (scipy.special)
- Integración (scipy.integrate)
- Optimización (scipy.optimize)
- Interpolación (scipy.interpolate)
- Transformadas de Fourier (scipy.fftpack)
- Procesamiento de señales (scipy.signal)
- Algebra lineal(scipy.linalg)
- Problemas de matrices dispersas (scipy.sparse)
- Estadística (scipy.stats)
- Procesamiento de imágenes multidimensional (scipy.ndimage)
- IO (scipy.io)
Buscando mínimos y máximos de una función.
%matplotlib inline

import matplotlib.pyplot as plt
from scipy import optimize
def f(x):
    return 4*x**3 + (x-2)**2 + x**4
fig, ax  = plt.subplots()
x = np.linspace(-5, 3, 100)
ax.plot(x, f(x));

Podemos usar la función fmin_bfgs para buscar los mínimos locales:
x_min = optimize.fmin_bfgs(f, -2)
x_min
Optimization terminated successfully.
         Current function value: -3.506641
         Iterations: 6
         Function evaluations: 30
         Gradient evaluations: 10
array([-2.67298167])
optimize.fmin_bfgs(f, 0.5)
Optimization terminated successfully.
         Current function value: 2.804988
         Iterations: 3
         Function evaluations: 15
         Gradient evaluations: 5
array([ 0.46961745])
optimize.brent(f)
0.46961743402759754
optimize.fminbound(f, -4, 2)
-2.6729822917513886
Alto nivel...
- pandas, "el cinturón de Batman para el analista de datos". El actor principal es el objeto DataFrame, una estructura de datos bidimensional con filas y columnas indexables, inspirado en el dataframe de R.
Algunas de sus principales características son:
- DataFrame
- Indexado por filas y columnas
- Indexado booleano
- Tratamiento de valores NA
- Broadcasting
- Excelente métodos de "split", "apply", "combine", "groupby"
- Estadística (media, std, corr, etc.)
- Mergeado, unión y concatenación de datasets
import pandas as pd

df2 = pd.DataFrame({ 'A' : 1.,
                     'B' : pd.Timestamp('20130102'),
                     'C' : pd.Series(1,index=range(4),dtype='float32'),
                     'D' : np.array([3] * 4,dtype='int32'),
                     'E' : 'foo' })
df2
| A | B | C | D | E | |
|---|---|---|---|---|---|
| 0 | 1 | 2013-01-02 | 1 | 3 | foo |
| 1 | 1 | 2013-01-02 | 1 | 3 | foo |
| 2 | 1 | 2013-01-02 | 1 | 3 | foo |
| 3 | 1 | 2013-01-02 | 1 | 3 | foo |
df2.dtypes
A           float64
B    datetime64[ns]
C           float32
D             int32
E            object
dtype: object
dates = pd.date_range('20130101', periods=6)

df = pd.DataFrame(np.random.randn(6,4),index=dates,columns=list('ABCD'))
df
| A | B | C | D | |
|---|---|---|---|---|
| 2013-01-01 | 0.328238 | 2.150125 | -0.431673 | 1.136437 |
| 2013-01-02 | -0.125009 | -0.924556 | 1.959384 | 0.012627 |
| 2013-01-03 | -1.614760 | 0.151343 | -0.508515 | 0.531091 |
| 2013-01-04 | 0.279493 | -0.374569 | 0.216071 | -0.776623 |
| 2013-01-05 | 0.111009 | 1.987822 | -0.300183 | 0.049401 |
| 2013-01-06 | 1.508283 | 1.887487 | 0.576780 | 0.351069 |
df.head(2)
| A | B | C | D | |
|---|---|---|---|---|
| 2013-01-01 | 0.328238 | 2.150125 | -0.431673 | 1.136437 |
| 2013-01-02 | -0.125009 | -0.924556 | 1.959384 | 0.012627 |
df.tail(3)
| A | B | C | D | |
|---|---|---|---|---|
| 2013-01-04 | 0.279493 | -0.374569 | 0.216071 | -0.776623 |
| 2013-01-05 | 0.111009 | 1.987822 | -0.300183 | 0.049401 |
| 2013-01-06 | 1.508283 | 1.887487 | 0.576780 | 0.351069 |
df.index
<class 'pandas.tseries.index.DatetimeIndex'>
[2013-01-01, ..., 2013-01-06]
Length: 6, Freq: D, Timezone: None
df.columns
Index(['A', 'B', 'C', 'D'], dtype='object')
df.values
array([[ 0.32823837,  2.15012542, -0.43167317,  1.13643701],
       [-0.12500919, -0.92455611,  1.95938424,  0.01262702],
       [-1.61476048,  0.15134312, -0.50851502,  0.5310914 ],
       [ 0.27949297, -0.37456868,  0.21607081, -0.77662322],
       [ 0.11100919,  1.98782224, -0.30018303,  0.0494015 ],
       [ 1.50828286,  1.88748657,  0.57677982,  0.35106879]])
df.describe()
| A | B | C | D | |
|---|---|---|---|---|
| count | 6.000000 | 6.000000 | 6.000000 | 6.000000 |
| mean | 0.081209 | 0.812942 | 0.251977 | 0.217334 |
| std | 1.005645 | 1.355717 | 0.935161 | 0.635474 |
| min | -1.614760 | -0.924556 | -0.508515 | -0.776623 |
| 25% | -0.066005 | -0.243091 | -0.398801 | 0.021821 |
| 50% | 0.195251 | 1.019415 | -0.042056 | 0.200235 |
| 75% | 0.316052 | 1.962738 | 0.486603 | 0.486086 |
| max | 1.508283 | 2.150125 | 1.959384 | 1.136437 |
df.T
| 2013-01-01 00:00:00 | 2013-01-02 00:00:00 | 2013-01-03 00:00:00 | 2013-01-04 00:00:00 | 2013-01-05 00:00:00 | 2013-01-06 00:00:00 | |
|---|---|---|---|---|---|---|
| A | 0.328238 | -0.125009 | -1.614760 | 0.279493 | 0.111009 | 1.508283 |
| B | 2.150125 | -0.924556 | 0.151343 | -0.374569 | 1.987822 | 1.887487 |
| C | -0.431673 | 1.959384 | -0.508515 | 0.216071 | -0.300183 | 0.576780 |
| D | 1.136437 | 0.012627 | 0.531091 | -0.776623 | 0.049401 | 0.351069 |
df.sort_index(axis=1, ascending=False)
| D | C | B | A | |
|---|---|---|---|---|
| 2013-01-01 | 1.136437 | -0.431673 | 2.150125 | 0.328238 |
| 2013-01-02 | 0.012627 | 1.959384 | -0.924556 | -0.125009 |
| 2013-01-03 | 0.531091 | -0.508515 | 0.151343 | -1.614760 |
| 2013-01-04 | -0.776623 | 0.216071 | -0.374569 | 0.279493 |
| 2013-01-05 | 0.049401 | -0.300183 | 1.987822 | 0.111009 |
| 2013-01-06 | 0.351069 | 0.576780 | 1.887487 | 1.508283 |
df.sort(columns='B')
| A | B | C | D | |
|---|---|---|---|---|
| 2013-01-02 | -0.125009 | -0.924556 | 1.959384 | 0.012627 |
| 2013-01-04 | 0.279493 | -0.374569 | 0.216071 | -0.776623 |
| 2013-01-03 | -1.614760 | 0.151343 | -0.508515 | 0.531091 |
| 2013-01-06 | 1.508283 | 1.887487 | 0.576780 | 0.351069 |
| 2013-01-05 | 0.111009 | 1.987822 | -0.300183 | 0.049401 |
| 2013-01-01 | 0.328238 | 2.150125 | -0.431673 | 1.136437 |
type(df['A'])
pandas.core.series.Series
df[0:3]
| A | B | C | D | |
|---|---|---|---|---|
| 2013-01-01 | 0.328238 | 2.150125 | -0.431673 | 1.136437 |
| 2013-01-02 | -0.125009 | -0.924556 | 1.959384 | 0.012627 |
| 2013-01-03 | -1.614760 | 0.151343 | -0.508515 | 0.531091 |
df['20130102':'20130104']
| A | B | C | D | |
|---|---|---|---|---|
| 2013-01-02 | -0.125009 | -0.924556 | 1.959384 | 0.012627 |
| 2013-01-03 | -1.614760 | 0.151343 | -0.508515 | 0.531091 |
| 2013-01-04 | 0.279493 | -0.374569 | 0.216071 | -0.776623 |
df.mean()
A    0.081209
B    0.812942
C    0.251977
D    0.217334
dtype: float64
df.apply(np.cumsum)
| A | B | C | D | |
|---|---|---|---|---|
| 2013-01-01 | 0.328238 | 2.150125 | -0.431673 | 1.136437 |
| 2013-01-02 | 0.203229 | 1.225569 | 1.527711 | 1.149064 |
| 2013-01-03 | -1.411531 | 1.376912 | 1.019196 | 1.680155 |
| 2013-01-04 | -1.132038 | 1.002344 | 1.235267 | 0.903532 |
| 2013-01-05 | -1.021029 | 2.990166 | 0.935084 | 0.952934 |
| 2013-01-06 | 0.487254 | 4.877653 | 1.511864 | 1.304002 |
df = pd.DataFrame(np.random.randn(10, 4))
df
| 0 | 1 | 2 | 3 | |
|---|---|---|---|---|
| 0 | -0.576594 | -0.061054 | 0.859952 | -0.106367 |
| 1 | 0.210657 | -0.824371 | -1.121105 | -0.074044 |
| 2 | 0.118547 | -0.515693 | 0.375065 | -0.794414 |
| 3 | 0.786152 | -0.696700 | 1.073428 | -0.821474 |
| 4 | 0.800526 | 1.396866 | -0.519570 | 0.474508 |
| 5 | -0.355360 | -0.340269 | 0.121216 | -0.935368 |
| 6 | -0.626343 | 1.351925 | -0.066515 | -0.088426 |
| 7 | -0.714864 | -0.971626 | -0.318298 | 0.862303 |
| 8 | -0.019332 | 0.605479 | 0.560010 | 2.458060 |
| 9 | 1.101688 | 1.319719 | 0.859383 | 0.700639 |
pieces = [df[:3], df[3:7], df[7:]]
pieces[0], pieces[2] = pieces[2], pieces[0]
pd.concat(pieces)
| 0 | 1 | 2 | 3 | |
|---|---|---|---|---|
| 7 | -0.714864 | -0.971626 | -0.318298 | 0.862303 |
| 8 | -0.019332 | 0.605479 | 0.560010 | 2.458060 |
| 9 | 1.101688 | 1.319719 | 0.859383 | 0.700639 |
| 3 | 0.786152 | -0.696700 | 1.073428 | -0.821474 |
| 4 | 0.800526 | 1.396866 | -0.519570 | 0.474508 |
| 5 | -0.355360 | -0.340269 | 0.121216 | -0.935368 |
| 6 | -0.626343 | 1.351925 | -0.066515 | -0.088426 |
| 0 | -0.576594 | -0.061054 | 0.859952 | -0.106367 |
| 1 | 0.210657 | -0.824371 | -1.121105 | -0.074044 |
| 2 | 0.118547 | -0.515693 | 0.375065 | -0.794414 |
df = pd.DataFrame({'A' : ['foo', 'bar', 'foo', 'bar',
                         'foo', 'bar', 'foo', 'foo'],
                   'B' : ['one', 'one', 'two', 'three',
                          'two', 'two', 'one', 'three'],
                   'C' : np.random.randn(8),
                   'D' : np.random.randn(8)})
df
| A | B | C | D | |
|---|---|---|---|---|
| 0 | foo | one | 2.198971 | 0.580460 |
| 1 | bar | one | 2.296764 | -0.457668 |
| 2 | foo | two | 0.268690 | -0.137156 |
| 3 | bar | three | 1.228435 | 2.440996 |
| 4 | foo | two | -2.387769 | -0.768026 |
| 5 | bar | two | 1.034477 | -0.701858 |
| 6 | foo | one | -0.372800 | -0.474752 |
| 7 | foo | three | -1.456959 | 0.423885 |
df.groupby('A').sum()
| C | D | |
|---|---|---|
| A | ||
| bar | 4.559676 | 1.281469 |
| foo | -1.749868 | -0.375589 |
df.groupby(['A','B']).sum()
| C | D | ||
|---|---|---|---|
| A | B | ||
| bar | one | 2.296764 | -0.457668 |
| three | 1.228435 | 2.440996 | |
| two | 1.034477 | -0.701858 | |
| foo | one | 1.826171 | 0.105708 |
| three | -1.456959 | 0.423885 | |
| two | -2.119079 | -0.905182 |
- statsmodels, modelos estadísticos y econometría
- Modelos de regresión lineal
- Modelos lineas generalizados
- Modelos lineares robustos
- Modelos de series de tiempo
- Estimadores no paramétricos
- Tests estadísticos
- Integración con pandas
import pandas as pd
import statsmodels.api as sm
import numpy as np

# read the data in
df = pd.read_csv("http://www.ats.ucla.edu/stat/data/binary.csv")

# rename the 'rank' column because there is also a DataFrame method called 'rank'
df.columns = ["admit", "gre", "gpa", "prestige"]
dummy_ranks = pd.get_dummies(df['prestige'], prefix='prestige')
dummy_ranks.head()
| prestige_1 | prestige_2 | prestige_3 | prestige_4 | |
|---|---|---|---|---|
| 0 | 0 | 0 | 1 | 0 |
| 1 | 0 | 0 | 1 | 0 |
| 2 | 1 | 0 | 0 | 0 |
| 3 | 0 | 0 | 0 | 1 |
| 4 | 0 | 0 | 0 | 1 |
# create a clean data frame for the regression
cols_to_keep = ['admit', 'gre', 'gpa']
data = df[cols_to_keep].join(dummy_ranks.ix[:, 'prestige_2':])
data.head()
| admit | gre | gpa | prestige_2 | prestige_3 | prestige_4 | |
|---|---|---|---|---|---|---|
| 0 | 0 | 380 | 3.61 | 0 | 1 | 0 |
| 1 | 1 | 660 | 3.67 | 0 | 1 | 0 |
| 2 | 1 | 800 | 4.00 | 0 | 0 | 0 |
| 3 | 1 | 640 | 3.19 | 0 | 0 | 1 |
| 4 | 0 | 520 | 2.93 | 0 | 0 | 1 |
# manually add the intercept
data['intercept'] = 1.0

train_cols = data.columns[1:]
# Index([gre, gpa, prestige_2, prestige_3, prestige_4], dtype=object)

logit = sm.Logit(data['admit'], data[train_cols])

# fit the model
result = logit.fit()

result.summary()
Optimization terminated successfully.
         Current function value: 0.573147
         Iterations 6
| Dep. Variable: | admit | No. Observations: | 400 |
|---|---|---|---|
| Model: | Logit | Df Residuals: | 394 |
| Method: | MLE | Df Model: | 5 |
| Date: | Wed, 01 Apr 2015 | Pseudo R-squ.: | 0.08292 |
| Time: | 21:15:07 | Log-Likelihood: | -229.26 |
| converged: | True | LL-Null: | -249.99 |
| LLR p-value: | 7.578e-08 |
| coef | std err | z | P>|z| | [95.0% Conf. Int.] | |
|---|---|---|---|---|---|
| gre | 0.0023 | 0.001 | 2.070 | 0.038 | 0.000 0.004 |
| gpa | 0.8040 | 0.332 | 2.423 | 0.015 | 0.154 1.454 |
| prestige_2 | -0.6754 | 0.316 | -2.134 | 0.033 | -1.296 -0.055 |
| prestige_3 | -1.3402 | 0.345 | -3.881 | 0.000 | -2.017 -0.663 |
| prestige_4 | -1.5515 | 0.418 | -3.713 | 0.000 | -2.370 -0.733 |
| intercept | -3.9900 | 1.140 | -3.500 | 0.000 | -6.224 -1.756 |
- Múltiples opciones para la visualización de datos.
Fuera del browser...
matplotlib
- Matplotlib es una biblioteca para generar figuras en 2 y 3 dimensiones.
- Es fácil de aprender.
- Soporta LATEX para etiquetas y texto.
- Cada uno de los elementos de la figura pueden controlarse programaticamente (reproducibilidad).
- Varios formatos para la exportación de las figuras: PNG, PDF, SVG y EPS.
- GUI para la exploraración interactiva las figuras.
- Galería
- ggplot, "me quiero parecer al ggplot de R"
- prettyplotlib, "no quiero ser tan feo como matplotlib"
- seaborn
- "quiero ser lindo e inteligente"
- Interfase de alto nivel para plotear gráficos estadísticos "lindos".
- Galería
- Un "entorno" unificado e interactivo.
- IPython/Jupyter, un interprete interactivo avanzado, un web-notebook, una infraestructura para computación en paralelo.
Y además...
- scikit-learn (a.k.a, machine learning en python)
Incluye (entre otras cosas):
- Biclustering
- Clustering
- Covariance estimation
- Cross decomposition
- Dataset examples
- Decomposition
- Ensemble methods
- Gaussian Process for Machine Learning
- Generalized Linear Models
- Manifold learning
- Gaussian Mixture Models
- Nearest Neighbors
- Semi Supervised Classification
- Support Vector Machines
- Decision Trees
import numpy as np
import pylab as pl
from matplotlib.colors import ListedColormap
from sklearn.cross_validation import train_test_split
from sklearn.preprocessing import StandardScaler
from sklearn.datasets import make_moons, make_circles, make_classification
from sklearn.neighbors import KNeighborsClassifier
from sklearn.svm import SVC
from sklearn.tree import DecisionTreeClassifier
from sklearn.ensemble import RandomForestClassifier
from sklearn.naive_bayes import GaussianNB
from sklearn.lda import LDA
from sklearn.qda import QDA

h = .02  # step size in the mesh

names = ["Nearest Neighbors", "Linear SVM", "RBF SVM", "Decision Tree",
         "Random Forest", "Naive Bayes", "LDA", "QDA"]
classifiers = [
    KNeighborsClassifier(3),
    SVC(kernel="linear", C=0.025),
    SVC(gamma=2, C=1),
    DecisionTreeClassifier(max_depth=5),
    RandomForestClassifier(max_depth=5, n_estimators=10, max_features=1),
    GaussianNB(),
    LDA(),
    QDA()]

X, y = make_classification(n_features=2, n_redundant=0, n_informative=2,
                           random_state=1, n_clusters_per_class=1)
rng = np.random.RandomState(2)
X += 2 * rng.uniform(size=X.shape)
linearly_separable = (X, y)

datasets = [make_moons(noise=0.3, random_state=0),
            make_circles(noise=0.2, factor=0.5, random_state=1),
            linearly_separable
            ]

figure = pl.figure(figsize=(24, 8))
i = 1
# iterate over datasets
for ds in datasets:
    # preprocess dataset, split into training and test part
    X, y = ds
    X = StandardScaler().fit_transform(X)
    X_train, X_test, y_train, y_test = train_test_split(X, y, test_size=.4)

    x_min, x_max = X[:, 0].min() - .5, X[:, 0].max() + .5
    y_min, y_max = X[:, 1].min() - .5, X[:, 1].max() + .5
    xx, yy = np.meshgrid(np.arange(x_min, x_max, h),
                         np.arange(y_min, y_max, h))

    # just plot the dataset first
    cm = pl.cm.RdBu
    cm_bright = ListedColormap(['#FF0000', '#0000FF'])
    ax = pl.subplot(len(datasets), len(classifiers) + 1, i)
    # Plot the training points
    ax.scatter(X_train[:, 0], X_train[:, 1], c=y_train, cmap=cm_bright)
    # and testing points
    ax.scatter(X_test[:, 0], X_test[:, 1], c=y_test, cmap=cm_bright, alpha=0.6)
    ax.set_xlim(xx.min(), xx.max())
    ax.set_ylim(yy.min(), yy.max())
    ax.set_xticks(())
    ax.set_yticks(())
    i += 1

    # iterate over classifiers
    for name, clf in zip(names, classifiers):
        ax = pl.subplot(len(datasets), len(classifiers) + 1, i)
        clf.fit(X_train, y_train)
        score = clf.score(X_test, y_test)

        # Plot the decision boundary. For that, we will asign a color to each
        # point in the mesh [x_min, m_max]x[y_min, y_max].
        if hasattr(clf, "decision_function"):
            Z = clf.decision_function(np.c_[xx.ravel(), yy.ravel()])
        else:
            Z = clf.predict_proba(np.c_[xx.ravel(), yy.ravel()])[:, 1]

        # Put the result into a color plot
        Z = Z.reshape(xx.shape)
        ax.contourf(xx, yy, Z, cmap=cm, alpha=.8)

        # Plot also the training points
        ax.scatter(X_train[:, 0], X_train[:, 1], c=y_train, cmap=cm_bright)
        # and testing points
        ax.scatter(X_test[:, 0], X_test[:, 1], c=y_test, cmap=cm_bright,
                   alpha=0.6)

        ax.set_xlim(xx.min(), xx.max())
        ax.set_ylim(yy.min(), yy.max())
        ax.set_xticks(())
        ax.set_yticks(())
        ax.set_title(name)
        ax.text(xx.max() - .3, yy.min() + .3, ('%.2f' % score).lstrip('0'),
                size=15, horizontalalignment='right')
        i += 1

figure.subplots_adjust(left=.02, right=.98)
pl.show()

Gracias!
[damianavila](https://github.com/damianavila)
[@damian_avila](http://twitter.com/damian_avila)
[www.damian.oquanta.info](http://www.damian.oquanta.info)