#!/usr/bin/env python
# coding: utf-8
# # `flotilla`: Data-driven conversations
#
# *Open-source Python package for iterative machine learning and visualization* | [YeoLab/flotilla](http://github.com/YeoLab/flotilla)
#
# Olga Botvinnik | [@olgabot](http://twitter.com/olgabot) | [github.com/olgabot](https://github.com/olgabot) | [olgabotvinnik.com](http://olgabotvinnik.com/)
# PhD Candidate in Bioinformatics at UCSD | [Gene Yeo Lab](http://yeolab.ucsd.edu/yeolab/Home.html)
# National Defense Science and Engineering Graduate Fellow
# NumFOCUS John Hunter Technical Fellow
# April 10th, 2015
#
# 
# ## The time between computational idea to experimental result
# 
# ## What is `flotilla`?
#
# `flotilla` is an open-source Python package for exploring data*.
#
# \**Currently, `flotilla` is focused on biological data such as single-cell and other large-scale RNA-seq transcriptome analyses*
#
# * Data
# * Computation
# * Visualization
# * Iterativity
# ### `flotilla` is ... Data
#
# * [`pandas`](http://pandas.pydata.org): Data reading, cleaning, reformatting
#
# 
#
# ### `flotilla` is ... Computation
#
# * [`scikit-learn`](http://scikit-learn.org/): Dimensionality reduction, classification, regression
#
# 
#
#
# ### `flotilla` is ... Visualization
#
# * [`matplotlib`](http://matplotlib.org/): Robust plotting package
# * [`seaborn`](http://stanford.edu/~mwaskom/software/seaborn/): Statistical data visualization
#
# 
# 
# ### `flotilla` is ... Iterative
#
# IPython/Jupyter Project [widgets](http://nbviewer.ipython.org/github/esss/ipython/blob/master/examples/Interactive%20Widgets/Index.ipynb)
#
# 
#
# 
# ## Why not just use these individual packages?
#
#
# While individually, `scikit-learn` makes it easy to run individual algorithms, `pandas` makes subsetting data a dream, `matplotlib` and `seaborn` make visualizing computational results a charm, and the IPython notebook makes stringing all of these together into reproducible document possible, **`flotilla` does something none of these other packages can.**
#
# ### `flotilla` shortens the distance between a hypothesis and its computational result
#
# ## Hypothesis: The human brain uses different genes in different regions
# ### The data: Allen Brain Institute
#
# Disclaimer: I am not a neuroscientist, and my understanding of brain anatomy is very rudimentary, so please bear with me.
#
# 
#
# We will use the [**BrainSpan Atlas of the Developing Human Brain**](http://www.brainspan.org/), which was an effort to establish molecular profiles of brain regions at varying points of developmental time.
#
# * 42 brain specimens, male and female
# * 13 developmental stages: post-conception week (pcw) 5-7 to 42 years old
#
# 
# ### RNA Sequencing is like reading a cell's mind
#
# 
#
#
# #### RNA sequencing is accomplished by shattering RNA transcripts, then finding where they are in the genome
# 
#
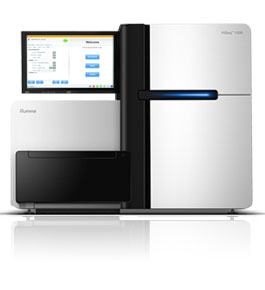
# #### Illumina sequencing machines
#
# 
# ### Load the data into `flotilla` via `embark`
# In[ ]:
get_ipython().run_line_magic('matplotlib', 'inline')
import flotilla
study = flotilla.embark(flotilla._brainspan)
# #### A look behind the magic
#
# `flotilla._brainspan` is just a link to a JSON file:
# In[ ]:
flotilla._brainspan
# This json follows the [datapackage](http://data.okfn.org/doc/data-package) specification as outlined by the Open Knowledge foundation.
# In[ ]:
get_ipython().system(' curl https://s3-us-west-2.amazonaws.com/flotilla/brainspan_batch_corrected_for_amazon_s3/datapackage.json')
# 2.) A string that is a name of a folder in `"~/flotilla_projects"`. If you use this study here, change something, and want to keep it around for later, you can use `study.save('project_name')` and then embark on it later with `flotilla.embark('project_name')`.
#
# #### Model-Compute-View-Controller
#
# Modified image of MVC
#
# labeled:
# * Model = pandas
# * Compute = scikit-learn
# * View = matplotlib, seaborn
# * controller = IPython notebook + widgets
# ### Back to the hypothesis: The human brain has different genes expressed in different regions
#
#
#
# To address the question of how the expression varies across regions, we will Principal component analysis.
#
# #### Principal Component Analysis (PCA)
#
# Principal Component Analysis (PCA) is a dimensionality reduction algorithm which transforms a high-dimensional space like gene expression, to smaller dimensions, like just two for x- y- plotting.
#
# 
# In[ ]:
# custom list: https://www.dropbox.com/s/wyjak3oh6z5myfm/cell_cycle_genes.txt?dl=0
study.interactive_pca()
# Hmm, all those non-cerebellar cortex, non-striatum samples are really stacked on top of each other. What if we want to pull out genes that are associated with a particular structure, like the hippocampus?
# In[ ]:
# # Cerebellum markers from http://www.nature.com/nrn/journal/v16/n2/fig_tab/nrn3886_F3.html
cerebellar_markers = ['ALDOC', 'PLCB3', 'SLC1A6', 'GABBR2', 'NCS1', 'PLCB4', 'GRM1', 'MAP1A', 'NPTN', 'NRGN']
for gene in cerebellar_markers:
study.plot_gene(gene)
# ## Hypothesis: Cells in the hippocampus use genes unique to its function
#
# The hippocampus is involved in memory, and we hypothesize that these cells have a unique molecular profile (set of genes that are expresssed). To accomplish this, we will use a classifier on our data to identify genes which separate hippocampal samples from non-hippocampal samples.
#
# By default, `flotilla` uses an "Extremely Randomised Trees" Classifier (`ExtraTreesClassifier`), which takes random subsets of the data many times to create decision trees, like this one for deciding whether to play outside:
#
# 
# In[ ]:
study.interactive_classifier()
# * Choose trait as "structure_acronym: HIP"
# * Choose features as "all features"
# ### Cilia are important for memory development
#
# FOXJ1, C1orf88, TEKT1 are all involved in development of cilia, fingerlike protrusions from cells. Development of these cilia has been show to be important in memory formation.
#
# So it looks like our classifier picked up the right things!
#
# 
#
# [](http://journals.plos.org/plosone/article?id=10.1371/journal.pone.0106576)
#
# [](http://www.jneurosci.org/content/31/27/9933.full)
# # Acknowledgements
#
# * Gene Yeo and the Yeo Lab, especially:
# * **Michael Lovci**
# * **Yan Song**
# * Boyko Kakaradov
# * Patrick Liu
# * Leen Jamal
# * Gabriel Pratt
#
#  #
# Funding:
#
#
# Funding:
#  #
#
#
#